Bespoke’s Morning Lineup – 8/27/25 – The Calm Before Nvidia (NVDA)
See what’s driving market performance around the world in today’s Morning Lineup. Bespoke’s Morning Lineup is the best way to start your trading day. Read it now by starting a two-week trial to Bespoke Premium. CLICK HERE to learn more and start your trial.
“We’re moving from a world where we have to understand computers to a world where they will understand us.” – Jensen Huang

Below is a snippet of commentary from today’s Morning Lineup. Start a two-week trial to Bespoke Premium to view the full report.
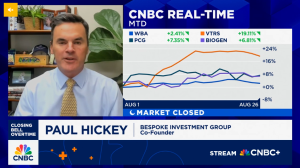
If you missed yesterday’s CNBC segment discussing recent market rotation, you can watch it by clicking on the image below.
It’s another quiet market morning with futures indicating just a modest gain at the open. Treasury yields are modestly higher across the curve, while crude oil is essentially flat at around $63 per barrel. In contrast, gold and other metals are slightly lower. There’s no economic data on the calendar this morning, and, outside of some earnings from retailers like Abercrombie & Fitch (ANF), Kohl’s (KSS), and Williams-Sonoma (WSM), the earnings calendar is light. Even the endless coverage of the Cook firing has subsided!
The quiet tone will change this afternoon when Nvidia (NVDA) reports after the close. Along with NVDA, we’ll also get reports from HP (HOQ), CrowdStrike (CRWD), NetApp (NTAP), and Urban Outfitters (URBN). The next two days will also be much busier on the economic calendar, so enjoy the calm while it lasts.
In Asia overnight, Japan was slightly higher while China traded lower as Industrial Profits for July fell 1.7% on a YTD basis. Australian stocks finished the session with fractional gains despite a CPI report which came in much higher than expected at 2.8% y/y versus forecasts for an increase of 2.3%.
European stocks are also trading much like US futures with little in the way of gains or losses. The STOXX 600 is up 0.15% with Germany trading slightly lower while France is bouncing back 0.45% from Tuesday’s 1.6% decline.
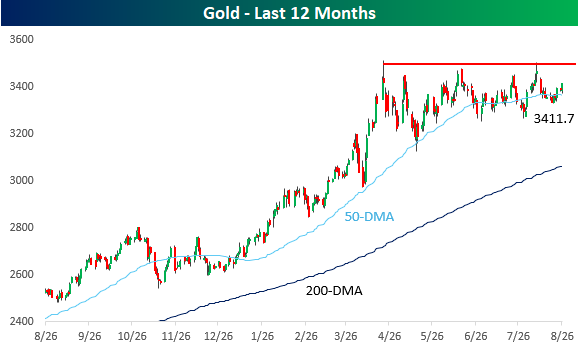
Gold prices are doing little this morning, and the last few months have been like watching paint dry for the yellow metal. After hitting an all-time high just above $3,500 per ounce in early April, gold has made multiple other attempts at breaking out above that level. While they have been unsuccessful, gold hasn’t sold off following those rejections, which has resulted in a relatively narrow range in recent months.
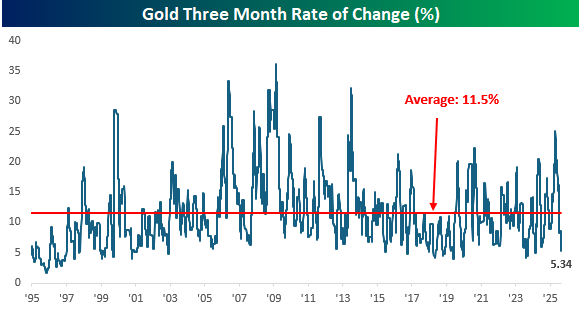
Over the last three months (63 trading days), in fact, the spread between gold’s intraday high and low has been just 5.34%, the narrowest three-day range since March 2024 and ranking in the bottom decile of three-month ranges over the last 30 years. This narrow range also marks a major shift from where this measure was four months ago in April, when the range topped 25% which was the widest since 2013.
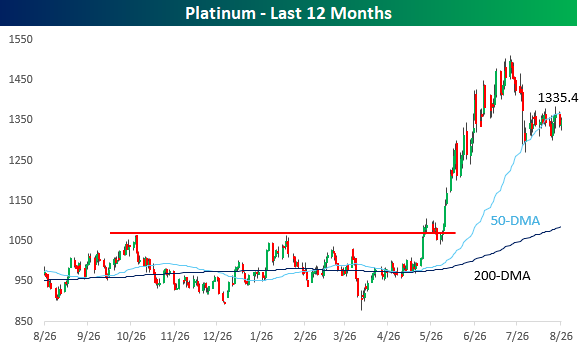
Like gold, platinum had been stuck in a range for several months from the second half of last year, with multiple run-ins with resistance just below $1,070. In late May/early June, though, it broke out of that range with vengeance surging as high as $1,500 before pulling back in July. Since that peak a little over a month ago, platinum has pulled back by about 11% and is now teetering on the 50-DMA, tenuously holding onto support. After such a large rally in such a short period, it’s only natural to see a pullback, so if these levels can hold, in the days ahead, platinum could start to look even more precious in the eyes of investors than it did even back in June.
The Closer – Fed Independence, Confidence, Credit Cards – 8/26/25
Log-in here if you’re a member with access to the Closer.
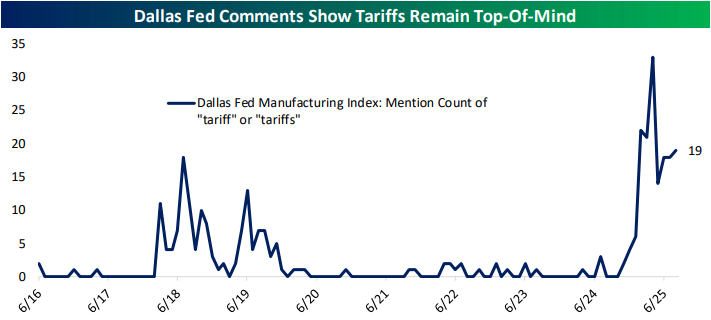
Looking for deeper insight into markets? In tonight’s Closer sent to Bespoke Institutional clients, we start out with further commentary on the situation surrounding the possible firing of Fed Governor Cook and some implications of a less independent Fed (pages 1 and 2). We then pivot over to the consumer confidence readings followed by the latest Fed manufacturing (page 3) and services data (page 4 and 5). We finish with a look at credit card delinquencies and the performance of related stocks (pages 6 and 7).
See today’s full post-market Closer and everything else Bespoke publishes by starting a 14-day trial to Bespoke Institutional today!
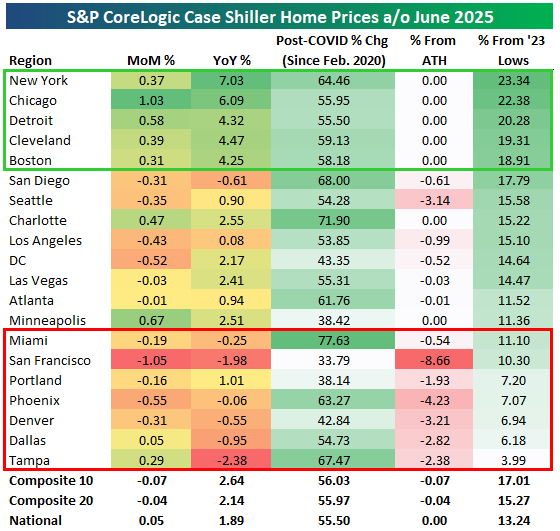
Supply, Not Sun, Powers Housing Gains
Below is an updated look at the most recent release of S&P/CoreLogic Case Shiller Home Price indices. As of June 2025, the data shows national home prices up 1.89% year-over-year and 55.5% since February 2020, with the Composite 20 index just 0.15% below all-time highs. On a monthly basis, price changes were mixed across regions, with Chicago (+1.03%), Detroit (+0.58%), and Minneapolis (+0.67%) posting the strongest gains, while San Francisco (-1.05%), Dallas (-0.92%), and Seattle (-0.35%) recorded declines. Year-over-year growth is most pronounced in New York (+7.03%), Chicago (+6.09%), and Detroit (+4.32%), while markets like San Francisco (-1.98%), Tampa (-2.38%), and San Diego (-0.61%) are down versus last year.
Since the onset of COVID, most markets remain significantly higher, led by Miami (+77.6%), Charlotte (+71.9%), and Tampa (+67.5%). By contrast, San Francisco (+33.8%), Minneapolis (+38.4%), and Portland (+38.1%) have seen the smallest increases. Relative to all-time highs, only a handful of markets are meaningfully below peak levels, including San Francisco (-8.7%), Portland (-4.2%), and Phoenix (-3.7%), while many regions like New York, Chicago, Detroit, and Boston are right at record highs. From their 2023 lows, markets like New York (+23.3%), Chicago (+22.4%), and Detroit (+20.3%) have rebounded sharply, while cities such as Tampa (+3.9%) and Denver (+6.9%) have recovered more modestly.
Below are price charts for each of the major cities tracked by Case Shiller going back to the end of 1989. Cities highlighted in green hit all-time highs in June. In looking at the charts, you’ll notice sideways action recently in previously hot markets in the sunbelt and out west, while supply-constrained areas like New York, Chicago, Boston, Cleveland, and Detroit continue to see home prices push higher and higher.
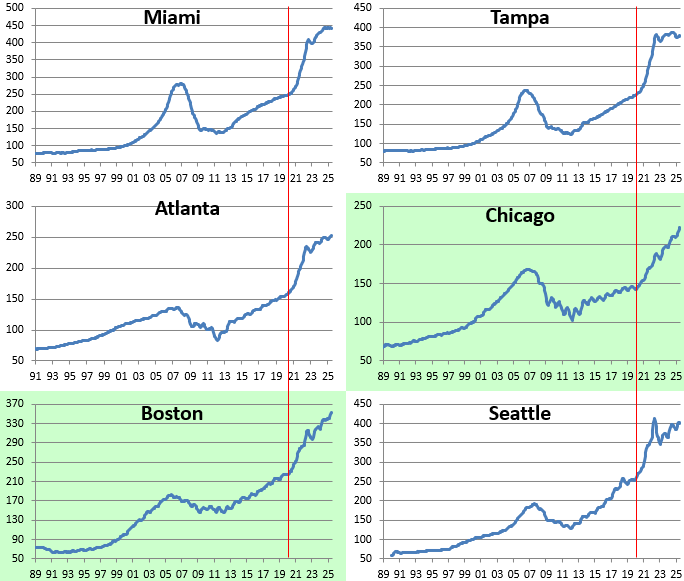
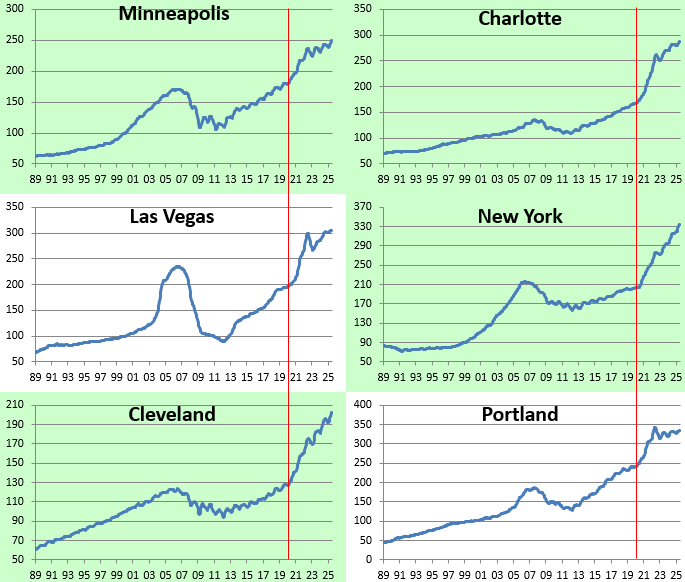
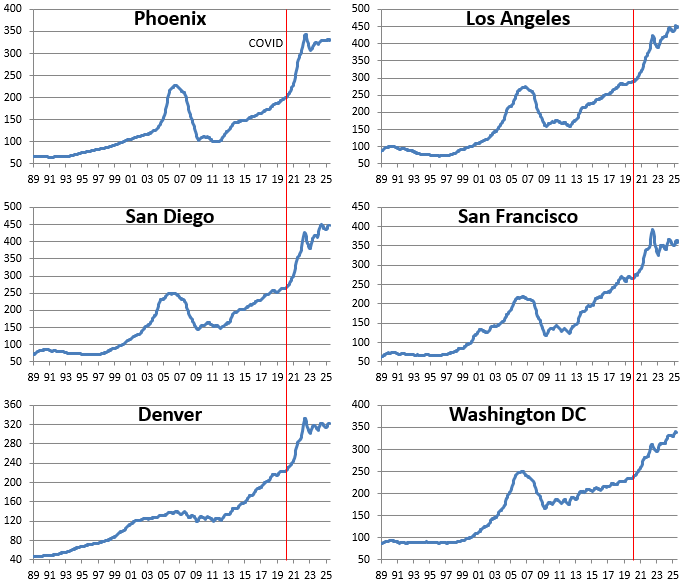
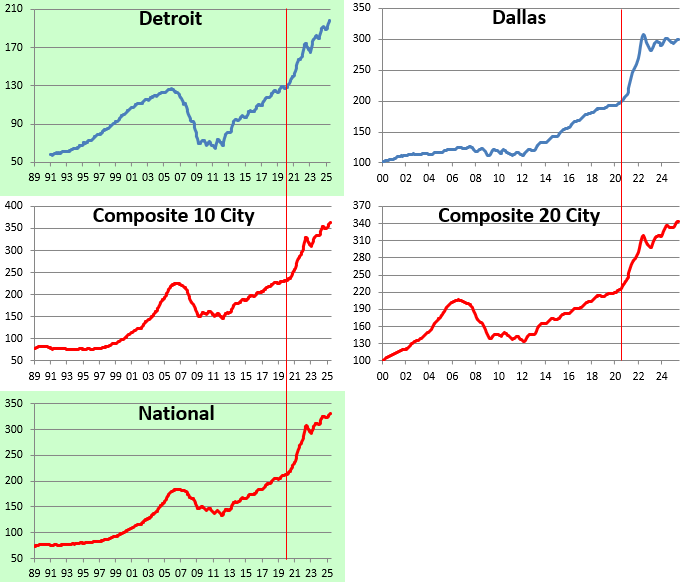

Chart of the Day – Big, Broad Move in Small Caps
Bespoke’s Morning Lineup – 8/26/25 – Drama at the Federal Reserve
See what’s driving market performance around the world in today’s Morning Lineup. Bespoke’s Morning Lineup is the best way to start your trading day. Read it now by starting a two-week trial to Bespoke Premium. CLICK HERE to learn more and start your trial.
“If you can go through life without experiencing pain you probably haven’t been born yet.” – Neil Simon
Below is a snippet of commentary from today’s Morning Lineup. Start a two-week trial to Bespoke Premium to view the full report.
If last week’s rally to close out the week felt like a Friday, this morning’s futures feel a bit like a Monday as futures are modestly lower in what feels like a sluggish market. The big headline this morning is probably a story from Friday where the President threatened tariffs on furniture makers who import goods from overseas. Stocks like Wayfair and RG are trading sharply lower in response,
The only economic reports on the calendar are New Home Sales at 10 AM and the Dallas Fed report at 10:30. Earnings season is mostly over, except for the elephant in the room – Nvidia (NVDA)- which reports Wednesday after the close.
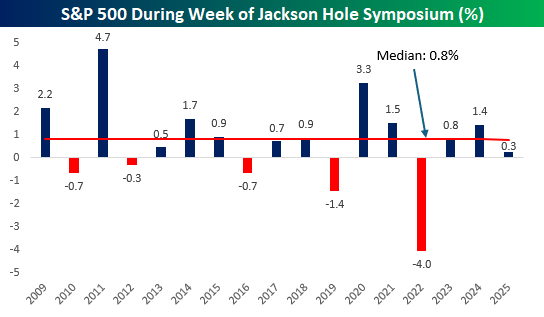
Friday’s gain wasn’t the first 1%+ rally this summer, but it was the largest gain for the S&P 500 since the day after Memorial Day. Even with that gain, the S&P 500 only managed to squeak out a gain of 0.3% for the week, owing to the five-day losing streak that the market was riding heading into Friday. Last week, we showed the chart of the S&P 500’s performance during the week of the Fed’s Jackson Hole symposium, and below we have updated it to include last week’s 0.3% gain. While it was a weaker-than-normal Jackson Hole week, last week was the third straight year of positive returns and the fifth in the last six.
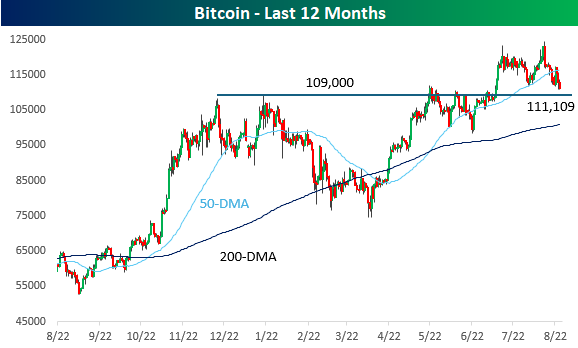
While most investors were checked out for the weekend, crypto markets had some major moves. Bitcoin, the world’s largest cryptocurrency, gave up all of Friday’s gains and fell to its lowest level since early July. The catalyst for the decline was a massive sale of 24,000 coins worth over $167 billion from a Bitcoin whale on Saturday. As shown in the chart below, for now, Bitcoin remains above support at the $109,000 level, but a break of that support within just two weeks of hitting a record high wouldn’t be a positive technical signal.
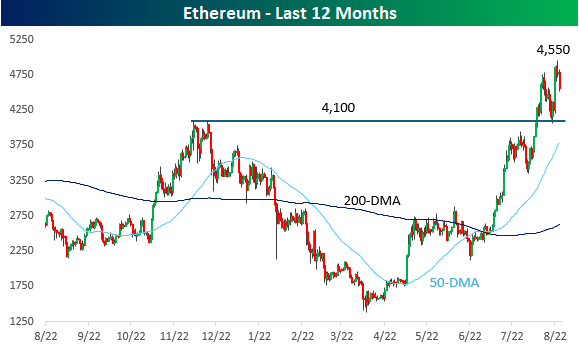
While Bitcoin investors may have been wishing that it didn’t trade on weekends after Saturday’s decline, Ethereum continues to gain attention and share in the crypto space. Around the time that Bitcoin was hitting record highs a couple of weeks ago, Ethereum was pulling back and testing support from its highs last fall. That support held, and over the weekend, Bitcoin broke out to new 52-week and record highs.
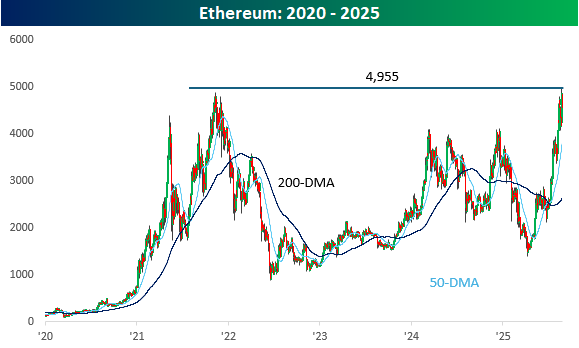
Looking at Ethereum from a 5-year time frame, its parabolic run over the last several weeks rocketed right through prior resistance in the low 4,000 range, right up to the highs from late 2021 and just under 5,000.
Exploring Trends Across Asset Classes, Mega-Caps, and Banks
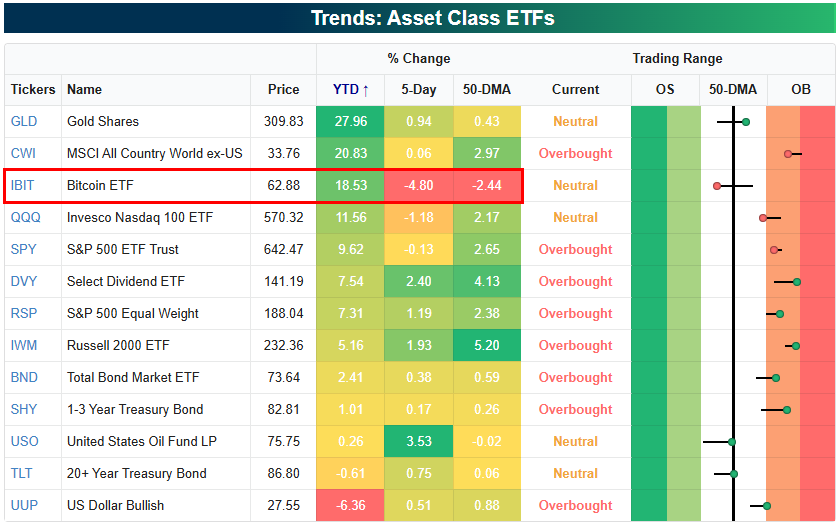
Equities have stalled out in the last half of August as a buyer’s strike ahead of the seasonally weak month of September takes hold. Below is a look at where equity ETFs and other asset-class ETFs stand within their trading ranges using our Trend Analyzer tool. Notably, gold (GLD) is now solidly in the lead in terms of year-to-date percentage change after Bitcoin (IBIT) has fallen off dramatically in the last week. Of the various asset class ETFs shown, Bitcoin (IBIT) is easily down the most week-over-week with a drop of 4.8%. On the flip side, oil (USO) is up the most with a gain of 3.5%.
Looking at the mega-caps, the best performer over the last week has been Tesla (TSLA), which remains the worst performer of the group on a year-to-date basis. Alphabet (GOOGL) is the only other mega-cap in the green over the last week, while the rest of them are down 1%+. So far, Microsoft (MSFT) is the only one that has moved back below its 50-day moving average.

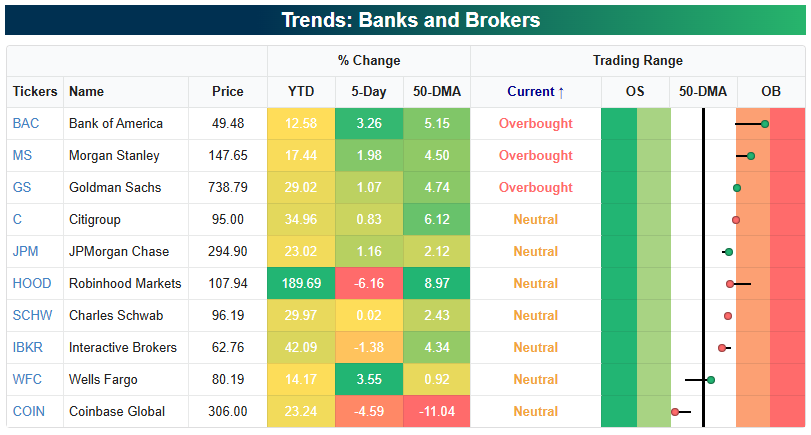
One other area of the market worth looking at is the banks and brokerage firms. While Bank of America (BAC) is up the least year-to-date of any of the stocks shown, it’s up the most over the last week with a gain of 3.3%. BAC is also now the most overbought stock of the bunch as it trades nearly two standard deviations above its 50-day moving average. On the flipside, Coinbase’s (COIN) 4.6% drop over the last week leaves it as the only name in the group that’s below its 50-DMA.
As a reminder, you can monitor trends across ETFs, sectors, groups, and indices using our Trend Analyzer tool, available to Bespoke members.
The Closer – Funding, New Homes, AI Dynamics – 8/25/25
Log-in here if you’re a member with access to the Closer.
Looking for deeper insight into markets? In tonight’s Closer sent to Bespoke Institutional clients, we start out with commentary on funding markets (page 1) followed by a look into the latest manufacturing data out of the Dallas Fed (page 2). We then shift over to the update on new home sales (page 3). Afterward, we review the differing performance in AI names (page 4) and close out with a rundown of the latest positioning data (page 5).
See today’s full post-market Closer and everything else Bespoke publishes by starting a 14-day trial to Bespoke Institutional today!
If Alphabet “Missed the AI Boat”, What Does That Mean for Microsoft?
Since the launch of ChatGPT, the consensus has been that Microsoft (MSFT) has been one of the AI winners while Alphabet (GOOGL) missed the boat. Some of the criticism towards GOOGL was earned as the company was late in launching a consumer AI product/tool, and then had a clumsy launch once it did. What many investors overlooked, though, was the fact that GOOGL branded itself an ‘AI first’ company way back in April 2016. Now, just because a company calls itself AI-first doesn’t mean it is. After all, anyone can say they’re an NFL-caliber quarterback, but only three dozen or so people are at any one time. In GOOGL’s case, though, missing the boat was hardly an accurate description of the situation.
Even now, nearly three years after the launch of ChatGPT, most investors view MSFT as the winner relative to GOOGL, if for no other reason than its investments in OpenAI that have given it a 49% share of the company’s future profits. Given the overall sentiment, how much do you think MSFT has outperformed GOOGL by since the launch of ChatGPT? The answer is that it hasn’t. As shown in the chart below, while MSFT has nearly doubled (+97.9%), GOOGL is now up nearly ten percentage points more with a gain of 107.6% and has just eclipsed MSFT in the back-and-forth race for outperformance.
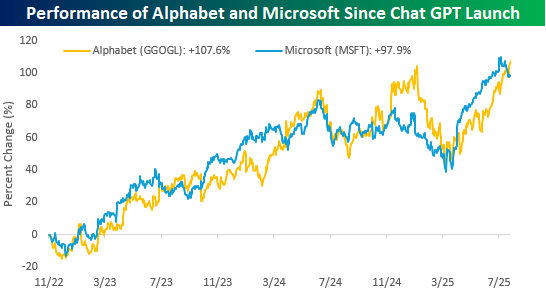
The chart below shows the performance spread between the two stocks since ChatGPT’s launch. For the most part, GOOGL has been moderately underperforming MSFT, but it hasn’t been consistent. Overall, the average margin of underperformance has been less than 3 percentage points, so it has hardly been a runaway train in favor of MSFT. Even more, the widest the performance spread has grown between the two stocks at any point since ChatGPT’s launch was 43 percentage points in GOOGL’s favor. For MSFT, there hasn’t been a point since ChatGPT’s launch where it outperformed GOOGL by more than 31 percentage points. If GOOGL missed it, what exactly was the boat it missed?

Chart of the Day: August Vacation for Winners
Bespoke’s Morning Lineup – 8/25/25 – While You Were Out
See what’s driving market performance around the world in today’s Morning Lineup. Bespoke’s Morning Lineup is the best way to start your trading day. Read it now by starting a two-week trial to Bespoke Premium. CLICK HERE to learn more and start your trial.
“Some people without brains do an awful lot of talking, don’t you think?” – The Wizard of Oz
Below is a snippet of commentary from today’s Morning Lineup. Start a two-week trial to Bespoke Premium to view the full report.
If last week’s rally to close out the week felt like a Friday, this morning’s futures feel a bit like a Monday as futures are modestly lower in what feels like a sluggish market. The big headline this morning is probably a story from Friday where the President threatened tariffs on furniture makers who import goods from overseas. Stocks like Wayfair and RG are trading sharply lower in response,
The only economic reports on the calendar are New Home Sales at 10 AM and the Dallas Fed report at 10:30. Earnings season is mostly over, except for the elephant in the room – Nvidia (NVDA)- which reports Wednesday after the close.
Friday’s gain wasn’t the first 1%+ rally this summer, but it was the largest gain for the S&P 500 since the day after Memorial Day. Even with that gain, the S&P 500 only managed to squeak out a gain of 0.3% for the week, owing to the five-day losing streak that the market was riding heading into Friday. Last week, we showed the chart of the S&P 500’s performance during the week of the Fed’s Jackson Hole symposium, and below we have updated it to include last week’s 0.3% gain. While it was a weaker-than-normal Jackson Hole week, last week was the third straight year of positive returns and the fifth in the last six.
While most investors were checked out for the weekend, crypto markets had some major moves. Bitcoin, the world’s largest cryptocurrency, gave up all of Friday’s gains and fell to its lowest level since early July. The catalyst for the decline was a massive sale of 24,000 coins worth over $167 billion from a Bitcoin whale on Saturday. As shown in the chart below, for now, Bitcoin remains above support at the $109,000 level, but a break of that support within just two weeks of hitting a record high wouldn’t be a positive technical signal.
While Bitcoin investors may have been wishing that it didn’t trade on weekends after Saturday’s decline, Ethereum continues to gain attention and share in the crypto space. Around the time that Bitcoin was hitting record highs a couple of weeks ago, Ethereum was pulling back and testing support from its highs last fall. That support held, and over the weekend, Bitcoin broke out to new 52-week and record highs.
Looking at Ethereum from a 5-year time frame, its parabolic run over the last several weeks rocketed right through prior resistance in the low 4,000 range, right up to the highs from late 2021 and just under 5,000.