Chart of the Day – New Highs and Apple Crosses
Bespoke’s Morning Lineup – 9/16/25 – Streaky Semis
See what’s driving market performance around the world in today’s Morning Lineup. Bespoke’s Morning Lineup is the best way to start your trading day. Read it now by starting a two-week trial to Bespoke Premium. CLICK HERE to learn more and start your trial.
“The beautiful thing about learning is nobody can take it away from you.” – B.B. King

Below is a snippet of commentary from today’s Morning Lineup. Start a two-week trial to Bespoke Premium to view the full report.
We’re looking at another positive start to the market this morning, with futures modestly higher and the Nasdaq leading the way as mega-caps continue to lead the way. This morning’s economic calendar includes Retail Sales and Import Prices at 8:30, Industrial Production and Capacity Utilization at 9:15, and then Business Inventories and Homebuilder Sentiment at 10. After that, pretty much all of the focus will shift to tomorrow’s announcement from the FOMC, where rates are widely expected to be cut 25 bps.
This morning’s gains follow what was mostly a positive session in Asia. The highlight of the region was South Korea, where the Kospi rallied more than 1% for its 11th straight daily gain. In Europe, the tone isn’t as positive as the STOXX 600 trades down 0.2% even as the ZEW survey of economic sentiment unexpectedly increased, although Industrial Production for the Eurozone rose less than expected (0.3% vs 0.4%).
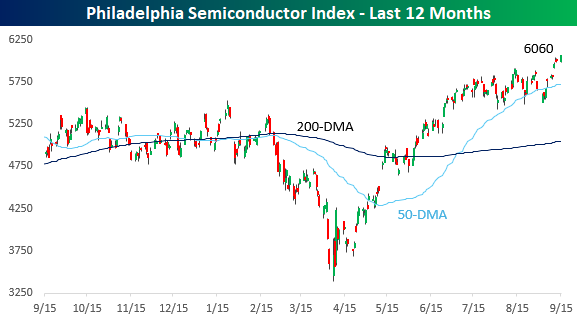
Like the major indices, semiconductor stocks have been lurching to new all-time highs, and when the semis are rallying with the overall market, it’s usually a good sign. After several successful tests of the 50-day moving average (DMA) in the summer, the Philadelphia Semiconductor Index (SOX) finally broke out above resistance last Wednesday.
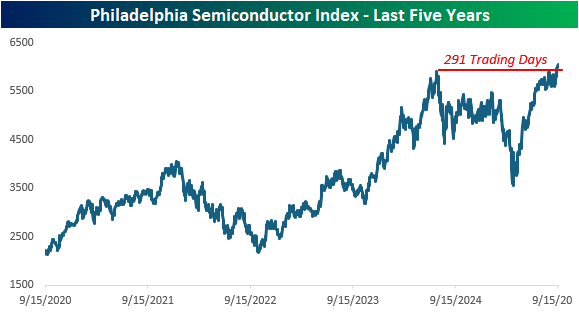
The breakout to new highs also ended a streak of more than a year during which the index had not traded at an all-time high. At 291 trading days, it was the fifth-longest drought without a new high in the SOX’s history, dating back to 199,4, and the sixth-longest that lasted longer than a year. The longest streak was nearly 4,500 trading days ending in January 2018, and the second-longest ended less than two years ago in December 2023 at 488 trading days.
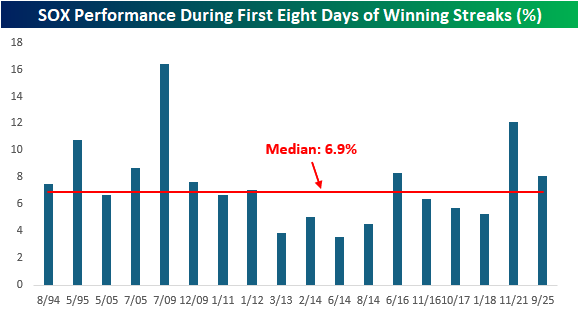
In the process of breaking out to new highs, the SOX has also traded higher for eight straight trading days, trailing the Nasdaq 100’s streak by a day. That eight-day streak is tied for the longest streak since October 2017, when it went more than two weeks in a row without trading lower. The longest streak was three weeks long, ending in early June 2014.
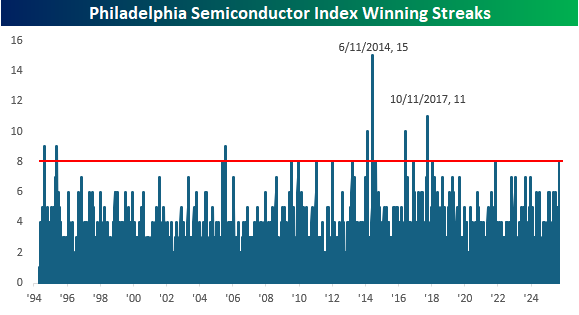
Over the course of the SOX’s eight-day streak, the index has rallied 8.1%, which comes in modestly ahead of the median gain of 6.9% during the first eight days of all 18 streaks and the sixth best overall.
The Closer – Price vs. Breadth, Farming, Gold – 9/15/25
Log-in here if you’re a member with access to the Closer.
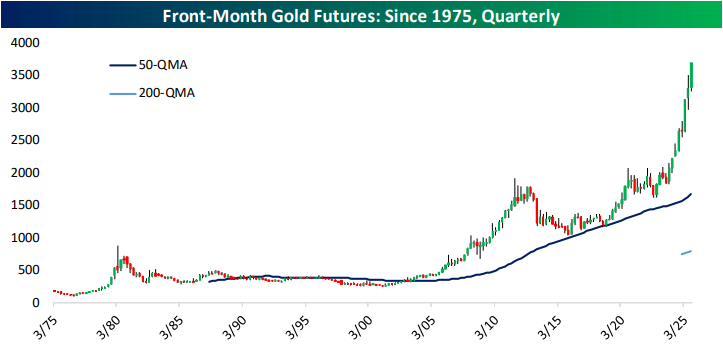
Looking for deeper insight into markets? In tonight’s Closer sent to Bespoke Institutional clients, we lead off with a look into the rare disconnect of extreme overbought stock prices on weak breadth (page 1). We follow up with a rundown on the rough go for farming (page 2) including farm employment and ag prices (page 3). We then provide a technical checkup on gold (pages 4 and 5) before pivoting over to the latest positioning data (pages 6 and 7).
See today’s full post-market Closer and everything else Bespoke publishes by starting a 14-day trial to Bespoke Institutional today!
Chart of the Day: Internals + After Hours vs. Intraday
7,8,9…
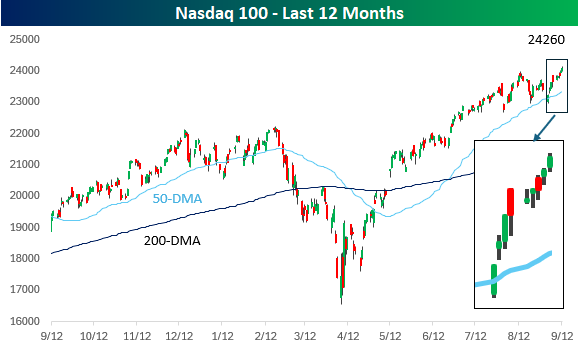
There are still a couple of hours left in the trading day, but with the Nasdaq 100 rallying more than 0.5%, it is on pace for its ninth straight day of gains. After gapping lower to start the month, it looked, on 9/2, like this September would show the weakness that typically accompanies the last month of the third quarter. After successfully testing the 50-day moving average (DMA) that day, though, the Nasdaq 100 has done nothing but trade higher, hitting new highs in the process.
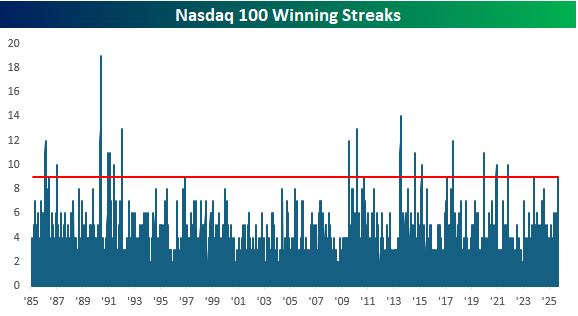
If the Nasdaq 100 does finish the session higher today, it will be its longest winning streak in nearly two years (November 2023) and tied for the longest since November 2021, or nearly four years! The longest daily winning streak in the index’s history was 19 back in May 1990, just two months before a July peak that led to a 33% decline in the subsequent weeks. We also found it notable that while extended winning streaks were relatively uncommon before 2009, they have become far more frequent in the last 15 years. For example, in the 23+ years from 1985 through 2008, there were just nine winning streaks of nine or more days, but in the last 16 years, there have been 13.
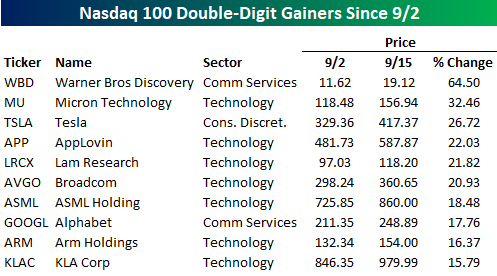
Over the course of the Nasdaq 100’s winning streak, the index’s 4.4% gain has been weaker than its average gain of 7.2% in the first nine trading days of prior streaks lasting nine or more days. As a result, there haven’t been a lot of big winners, and nearly half of the index’s components are lower since the streak began. Of the index’s 100 components, just ten are up 10% or more during the streak, with Warner Bros. Discovery (WBD) leading the way as merger speculation has pushed that stock up 64.5% since the close on 9/2. Besides WBD, seven of the ten stocks listed are from the Technology sector, and while not many stocks are up by double-digit percentages, an unlikely trio of mega-caps made the list with Tesla (TSLA), Broadcom (AVGO), and Alphabet (GOOGL) rallying 26.7%, 20.9%, and 17.8%, respectively.

Bespoke’s Consumer Pulse Report – September 2025
Bespoke’s Consumer Pulse Report is an analysis of a huge consumer survey that we run each month. Our goal with this survey is to track trends across the economic and financial landscape in the US. Using the results from our proprietary monthly survey, we dissect and analyze all of the data and publish the Consumer Pulse Report, which we sell access to on a subscription basis. Sign up for a 30-day free trial to our Bespoke Consumer Pulse subscription service. With a trial, you’ll get coverage of consumer electronics, social media, streaming media, retail, autos, and much more. The report also has numerous proprietary US economic data points that are extremely timely and useful for investors.
We’ve just released our most recent monthly report to Pulse subscribers, and it’s definitely worth the read if you’re curious about the health of the consumer in the current market environment. Start a 30-day free trial for a full breakdown of all of our proprietary Pulse economic indicators.

Bespoke’s Morning Lineup – 9/15/25 – Halfway Through September
See what’s driving market performance around the world in today’s Morning Lineup. Bespoke’s Morning Lineup is the best way to start your trading day. Read it now by starting a two-week trial to Bespoke Premium. CLICK HERE to learn more and start your trial.
“The best way to make your dreams come true is to wake up.” – Muhammad Ali
Below is a snippet of commentary from today’s Morning Lineup. Start a two-week trial to Bespoke Premium to view the full report.
After a strong week, markets are getting off to a positive start this week ahead of this week’s Fed meeting. The S&P 500 is indicated to open with a gain of 0.25%. Overnight, Asia was mixed, but Europe has been higher across the board. The economic calendar is light to kick off the week, as the Empire Manufacturing report came in weaker than expected. Later on this week, things will pick up with Retail Sales highlighting Tuesday’s schedule and Housing Starts and Building Permits coming on Wednesday, along with the Fed.
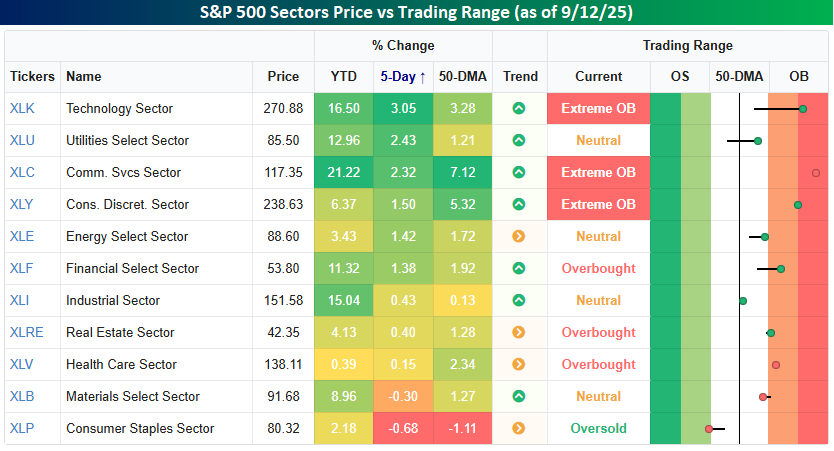
Markets are always forward-looking, and last week they looked forward to this week’s FOMC meeting, where Powell & Co will announce a cut of at least 25 basis points (bps) on Wednesday. Last week, six sectors rallied by at least 1%, including Technology, Utilities, and Communication Services, which rallied more than 2% each. We’ve grown accustomed to seeing Tech and Communication Services rally in unison. However, it’s still hard to get used to seeing the traditionally defensive-oriented Utilities sector rallying alongside those two sectors, but markets are always evolving. On the downside, the only sectors to finish lower last week were Consumer Staples and Materials. They’re also the only two sectors to finish last week below their 50-day moving averages. Consumer Staples is even oversold as well!
Six sectors finished last week at short-term overbought levels heading into this week’s Fed meeting, including three at ‘extreme’ overbought levels. While there is nothing prohibiting overbought sectors from becoming more overbought in the short term, it also sets up the possibility of a sell-the-news reaction to this week’s rate cuts. Just something to be on the lookout for.
Brunch Reads – 9/14/25
Welcome to Bespoke Brunch Reads — a linkfest of some of our favorite articles over the past week. The links are mostly market-related, but there are some other interesting subjects covered as well. We hope you enjoy the food for thought as a supplement to the research we provide you during the week.
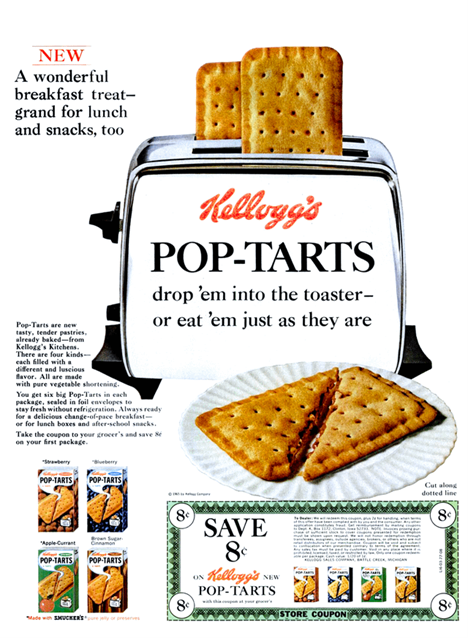
Pop-Tarts Pop Off: On September 14, 1964, Kellogg’s officially launched Pop-Tarts, forever changing the American breakfast. The idea came after Post had announced a similar product called “Country Squares,” but Kellogg’s rushed its own version to market first and captured the spotlight. The initial release featured just four flavors (strawberry, blueberry, brown sugar cinnamon, and apple currant), each sealed in foil so they could be stored without refrigeration, which was groundbreaking for the time.
When they hit shelves, demand was so overwhelming that stores couldn’t keep them in stock. Parents loved the convenience, kids loved the sweetness, and the “toaster pastry” became a cultural phenomenon almost overnight. Kellogg’s marketing leaned heavily into modern convenience, pitching Pop-Tarts as a quick, tidy breakfast for busy mornings. From frosted toppings introduced in the late 1960s to wild flavors and viral pop culture tie-ins today, the debut of Pop-Tarts was more than just a new product launch; it was a snapshot of 1960s America, where speed, convenience, and a sweet tooth collided.
Crime
How Bitcoin ATMs Are Helping Scammers Steal Millions (Inc)
Gas station clerks in Idaho have become unlikely front-line defenders against a wave of Bitcoin ATM scams that target seniors with fake government bills and doctored arrest warrants. Machines from companies like Bitcoin Depot and CoinFlip convert cash into untraceable crypto, and police say scammers have stolen at least $65 million through them in the first half of 2024 alone. With state rules patchy and federal action limited, regulators are suing operators while store employees are left unplugging ATMs to keep victims from handing over tens of thousands in cash to overseas fraud rings. [Link]
Continue reading our weekly Brunch Reads linkfest by logging in if you’re already a member or signing up for a trial to one of our two membership levels shown below! You can cancel at any time.

Another Strong Week for Stocks
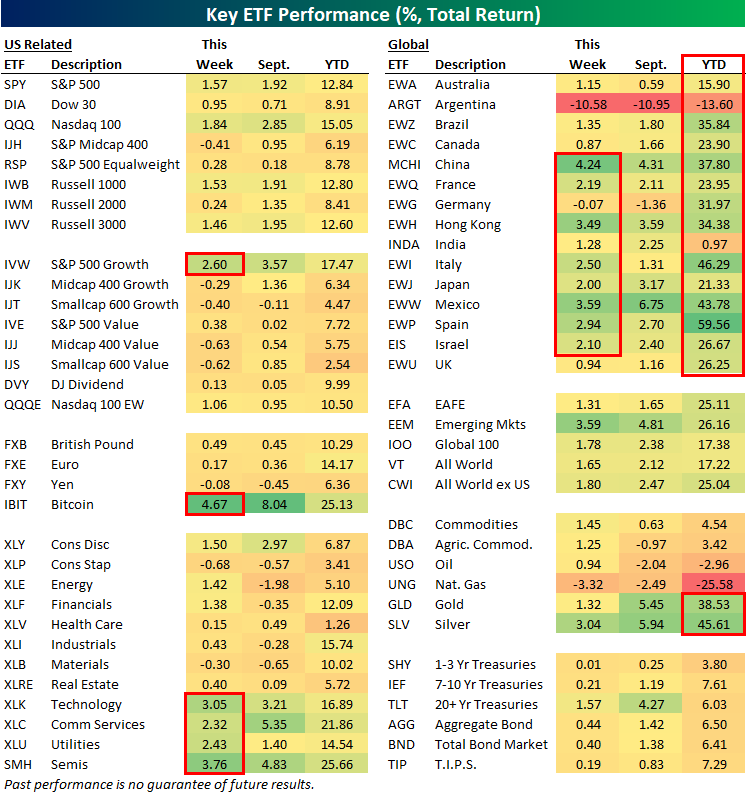
With the week now complete, below is a helpful look at the recent performance of various asset classes using key ETFs traded in the US.
Large-cap growth (IVW) was up 2.6% on the week, while mid-caps and small-caps actually fell. Technology (XLK) was the best performing sector due to Oracle’s (ORCL) massive gain, while Consumer Staples (XLP) and Materials (XLB) were the worst.
Outside of the US, there are a dozen country ETFs now up 20%+ on the year, which easily beats out SPY’s year-to-date gain of 12.8%. Spain (EWP) is up the most in 2025 with a huge gain of 59.6%.
Argentina (ARGT) and natural gas (UNG) were the two worst performing ETFs in our matrix this week.
Sticking with commodities, agriculture (DBA), gold (GLD), and silver (SLV) all rallied more than 1%, with GLD and SLV extending huge year-to-date gains.
Finally, Treasury ETFs were also up across the board this week as rates fell, especially at the long-end.
If you like this snapshot, we update it daily for Bespoke subscribers. Sign up now with our September Special to gain access.
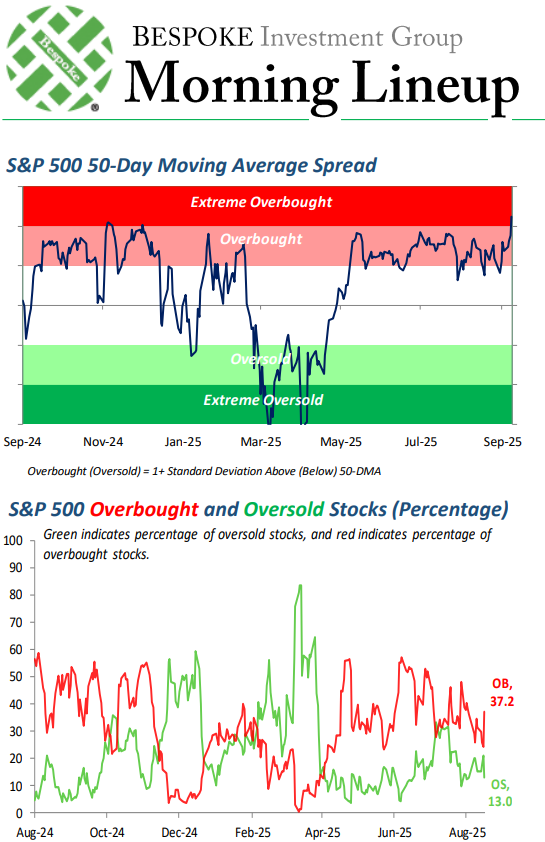
Extreme Overbought
The S&P 500 has had a great run over the last few weeks, but just yesterday it closed in “extreme overbought” territory for the first time since December. You can see the “extreme overbought” reading in our 50-DMA spread chart below (which gets published in our Morning Lineup each day).
Overbought levels are indicative of a market that’s extended. Price can’t stay overbought forever, and eventually mean reversion takes place.
But it’s worth knowing how the market has historically performed when it has gotten to “extreme overbought” levels for the first time in a long time. While there may be some weakness in the near-term, what about the next 3, 6, or 12 months?
If you’re interested in finding out, we’ve got the stats in this week’s Bespoke Report newsletter, which just got posted for subscribers.
The entire report is worth the read, so start a Bespoke Premium trial today! With a new membership, you’ll gain access to a lot more than just our weekly Bespoke Report.