200-Day Check-In
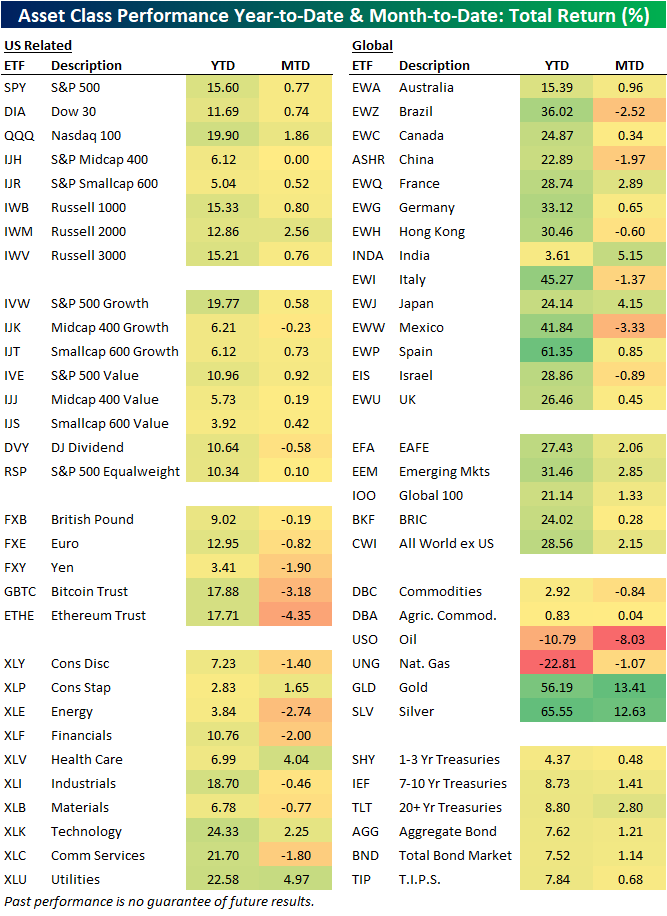
Yesterday marked the 200th trading day of the year. With tariff troubles, new policy implementations, geopolitical tensions, there’s already been a ton for markets to contend with in 2025. However, assets have broadly rallied anyways. In the table below, we show year to date returns through yesterday’s close across a range of ETFs covering a variety of assets both year-to-date through the first 200 trading days in addition to month-to-date for a look at more recent performance.
US equities are up double digits this year with the S&P 500 (SPY) gaining 15.6%, whereas the Nasdaq 100 (QQQ) is nearly up 20%. Small and mid-caps have some variation depending on how you look at them. The broader look at small caps, the Russell 2,000 (IWM), is only slightly underperforming the likes of SPY year-to-date. Meanwhile, the more selective S&P 600 (IJR), which is constructed only using companies that have reported positive earnings, is up a more modest 5% YTD. The midcap S&P 400 (IJH) is also up in the mid single digits. In other words, it has been the more speculative small caps gaining the most. Additionally, growth has outperformed value with the same small and mid-cap weakness relative to large caps.
On a sector level, the single best performer should come as no surprise: Tech (XLK) which has risen 24.3% YTD. The runner up may be more surprising: the historically defensive Utilities sector (XLU), which has gained 22.58%. The only other sector up over 20% is Communication Services (XLC), and two others, Financials (XLF) and Industrials (XLI), are up double digits. All other sectors have risen mid-to-low single digits with declines more recently MTD.
International stock markets using domestically-traded ETFs have handily outperformed the US this year. In fact, of those shown below, only two have underperformed the US (SPY) YTD, and those are Australia (EWA) and India (INDA). Finally, we would note that the single largest rallies haven’t come from the equity space this year as gold (GLD) and silver (SLV) are both up 50%+. In fact, GLD’s 13.4% MTD gain is only a couple percentage points less than what the S&P 500 has gained YTD.
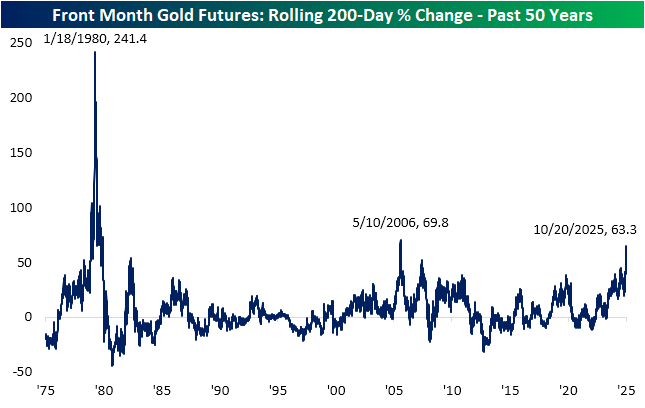
We have frequently noted this year’s strength in gold, although the yellow metal and its cohorts are reverting sharply lower today. We discussed that drop in an earlier B.I.G. Tip in addition to the Morning Lineup. With those declines in mind, that has not stolen from what has been a historic rally for gold prices. As shown below, over a 200-trading day span, gold’s over 60% gain is the largest since 2006; one factor of the rally back then was the emergence of gold ETFs like GLD. Prior to that, the only larger 200-day rally of the past half century came during 1979/1980 when there was a surge from catalysts including high inflation, geopolitical instability, and a speculative frenzy in silver.

Bespoke’s Morning Lineup – 10/21/25 – Strong Run of Earnings Continues
See what’s driving market performance around the world in today’s Morning Lineup. Bespoke’s Morning Lineup is the best way to start your trading day. Read it now by starting a two-week trial to Bespoke Premium. CLICK HERE to learn more and start your trial.
“In hindsight, I slid into arrogance based upon past success.” – Reed Hastings

Below is a snippet of commentary from today’s Morning Lineup. Start a two-week trial to Bespoke Premium to view the full report.
After a strong start to the week yesterday, US stocks are starting Tuesday on a modestly negative note with S&P 500 and Nasdaq futures both down less than 0.10%. The pace of earnings reports is finally starting to pick up, and what has been a strong reporting period so far in terms of results has remained that way this morning. As we type this, of the 14 companies reporting so far this morning, they have all exceeded EPS forecasts, and only one (NOC) missed top-line estimates. You can’t ask for much better than that!
With futures modestly lower, there’s still a lot of time left, but it’s pretty amazing to see that the S&P 500 still hasn’t traded outside of its intraday range from 10/10, which would make it seven straight days of trading inside a prior day’s range. Already, the current period ranks as just the 12th time in the last 40 years, and if the streak extends to seven, it would be just one of eight. For more on the topic, check out today’s Chart of the Day.
Outside of equities this morning, the 10-year yield is still below 4%, crude oil and natural gas are both up 1%, but precious metals are all uncharacteristically getting hit hard. Gold is down over 2%, while silver, platinum, and palladium are all down over 4%. Crypto prices also remain weak as Bitcoin trades back down below $110K and Ethereum is firmly below $4K with a decline of over 2.5%. Neither has been able to get back on track in the last couple of weeks.
Japanese stocks finished off their intraday highs overnight, but, along with other major indices in the region, finished higher on the session. Sanae Takaichi was officially elected PM, but there was a bit of sell-the-news reaction; Chinese stocks were the strongest in the region, finishing up more than 1% on optimism over US trade talks.
Europe is much like Asia this morning, with modest gains across the board. The STOXX 600 is up 0.1%, with Italy leading things higher, rallying by 1%.
Netflix (NFLX) will report earnings after the close today, which reminded us of an earnings report from the company in July 2011, when then CEO Reed Hastings announced that the company would be splitting off its DVD business from streaming, raising prices in the process. For consumers who wanted to continue with both services, the changes resulted in a 60% price hike from $10.00 to $15.98 per month. News of the price hikes and launch of the Qwikster DVD service were received poorly by the company’s customers and investors alike.
Right before the plan was announced, NFLX was trading at record highs, having just rallied 180% in the prior year. Within months, though, it gave up all of those gains, falling more than 70%. While there were other macro-related factors behind that drop, NFLX’s poorly communicated pricing plans and new strategy contributed to the weakness.
Following that decline in the wake of the Qwikster announcement, Hastings issued a public apology regarding how the changes were communicated, which included the quote above. Another month after his apology, Netflix reversed plans to separate the units (but kept the price hikes), relegating Qwikster to the waste bin of other disastrous product launches like New Coke, and more recently, the Cracker Barrel restaurant rebrand. Also, how can we ever forget the Apple Newton, rocking out with the Microsoft Zune, snacking on Olestra-infused WOW! Potato chips, and then the McDonald’s Arch Deluxe for dinner? The story of Qwikster and its demise before ever even launching serves as a reminder that the how of a message’s delivery can take on just as much importance as the message itself. It’s also a lesson that people and companies often become most vulnerable after a long string of successes, just as the feeling of invincibility starts to set in.
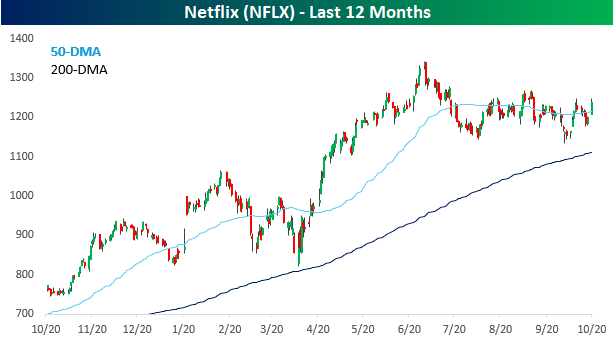
Hopefully, Netflix has no Qwiksters up its sleeve for today’s earnings report. Even after rallying 3% yesterday, the stock heads into the report short on momentum. While up over 60% in the last year and 25% in six months, the stock is down about 8% from its highs in the summer, forming a trend of lower highs. Looking on the bright side, the lack of a meaningful rally leading up to today’s report means that expectations likely aren’t too high.
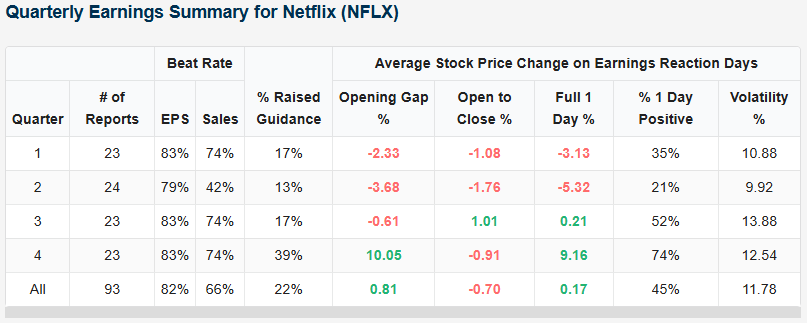
Looking at prior earnings reports from our Earnings Explorer, NFLX also has history slightly on its side. Over the last 23 years, its Q3 report has been the second-best of the four quarters in terms of stock price reaction. As shown in the table below, like Q4, NFLX has exceeded EPS forecasts 83% of the time in Q3 and topped sales forecasts 74% of the time. On its earnings reaction day, the stock averaged a gain of 0.21% with gains 52% of the time. That’s peanuts compared to the average gain of 9.2% following Q4 reports, but it beats the sharp declines that tend to follow Q1 and Q2 reports.
While NFLX will get most of the investor attention after the close today, another stock with a strong track record heading its report today is Capital One Financial (COF). Given its business, it will also give us a good read on the health of the consumer.
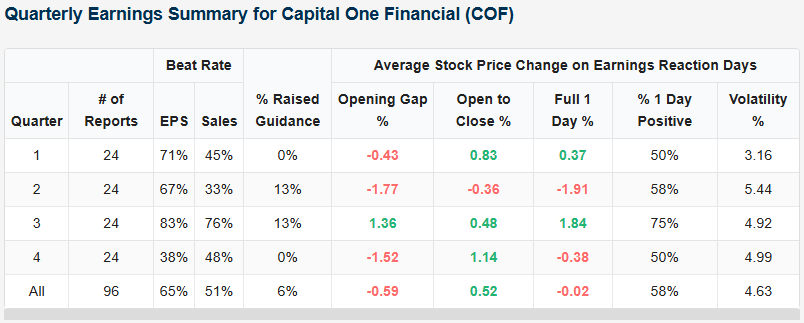
As shown in the snapshot below, COF has exceeded EPS and sales forecasts more in Q3 than in any other quarter. As a result, its average earnings reaction day performance has been a gain of 1.84% with positive returns 75% of the time. That’s also better than any other quarter.
Even more notable for COF is that the company has reacted positively to earnings for an incredible 12 straight quarters! Looking at COF’s one-day reactions to earnings over the last 20 years shows an interesting pattern. Whereas there was no streaky trend in terms of stock price reactions from 2005 through 2019, since then, it has been the opposite. COF has gone nine straight quarters with positive one-day reactions, then five straight quarters with negative reactions, followed by 12 quarters in a row of positive reactions. Talk about streaky!
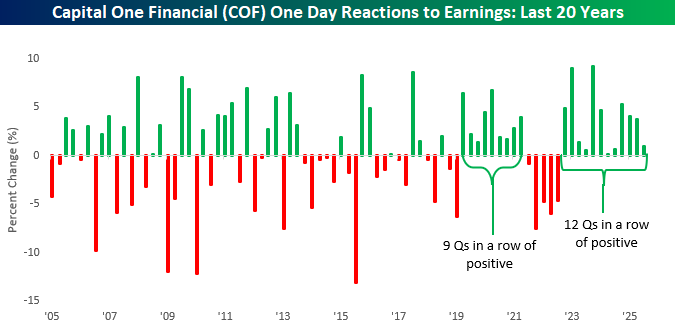
Chart of the Day – Inside Day Streaks
The Closer – The Long Run, Apple (AAPL) Records, BoC – 10/20/25
Log-in here if you’re a member with access to the Closer.
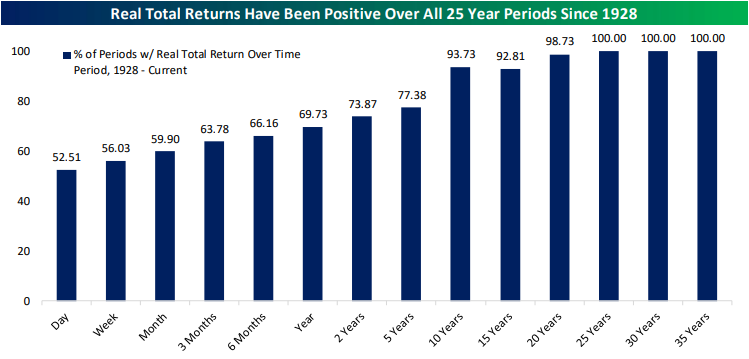
Looking for deeper insight into markets? In tonight’s Closer sent to Bespoke Institutional clients, we kick off with a look at how often real returns are positive over the long run (page 1) in addition to Apple (AAPL) breaking out to a new record (page 2). After that, we dive into the latest earnings reports (page 3) including results from Zion Bancorp (ZION) and Steel Dynamics (STLD). We then finish with a dive into the Q3 release of the Bank of Canada’s business and consumer surveys (page 4).
See today’s full post-market Closer and everything else Bespoke publishes by starting a 14-day trial to Bespoke Institutional today!
Chart of the Day: 30%+ Rallies Without a 3%+ Drop
Here Come the Earnings
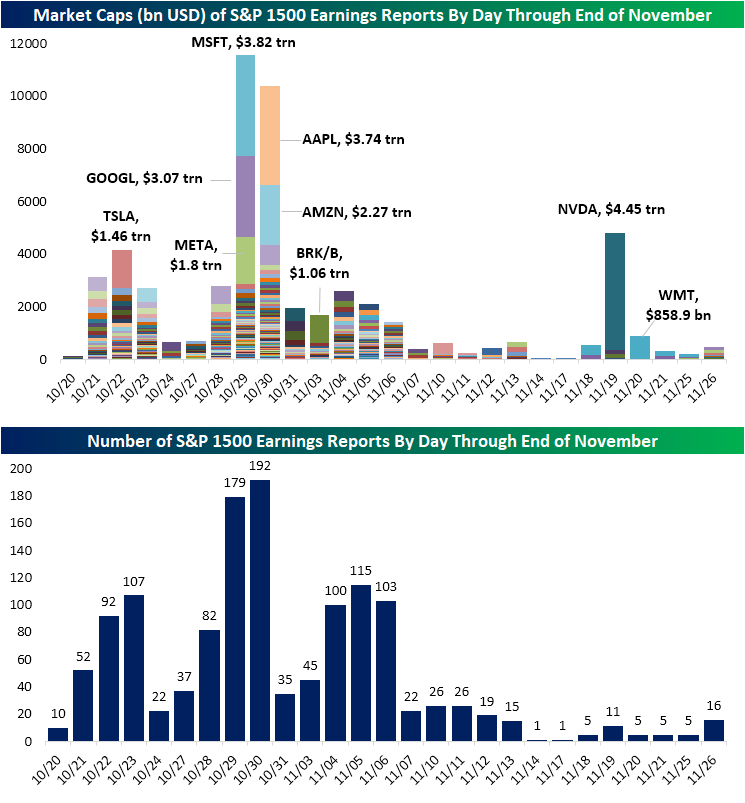
Earnings season is off to the races as the first of the major players in the Financials sector reported last week. While the calendar is relatively quiet today to start the week, things will quickly ramp up. Among S&P 1500 companies, tomorrow has 52 stocks reporting with a combined market cap of over $3 trillion. The following days this week will have the first of the mega-caps with Tesla (TSLA) results Wednesday night. In addition to the huge market cap from TSLA alone, we’ll get a large number of reports in the middle of this week too with nearly 200 companies in the 48 hours between Wednesday and Thursday.
The back half of next week is when the earnings calendar will ramp back up into the peak of earnings season. Next Wednesday will have 179 reports, and the following day will have nearly 200. Included in those are another large share of mega caps: Meta (META), Alphabet (GOOGL), and Microsoft (MSFT)’s combined $9.32 trillion in market cap make reports on Wednesday help contribute to the single most impactful day of earnings. Amazon (AMZN) and Apple (AAPL) report on Thursday too, and after that Berkshire (BRK.B) will be the only other mega-cap report for another couple of weeks when NVIDIA (NVDA) and Walmart (WMT) round out earnings season in mid-November. Looking to that first week of November, although Berkshire is the only stand out in terms of market cap, the calendar is still very busy with multiple days exceeding over 100 reports from S&P 1500 members.
Q3 2025 Earnings Conference Call Recaps: American Express (AXP)
Bespoke’s Conference Call Recaps use AI to summarize lengthy earnings calls. The commentary below is AI-generated and then edited by Bespoke for quality control. As always, none of these summaries should be construed as recommendations to buy or sell any securities, and investors should do their own research and/or consult with a financial professional before making any investment decisions.
Our latest recap available to Bespoke subscribers covers American Express’ (AXP) Q3 2025 earnings call.
![]()
American Express (AXP) is a global payments and financial services company known for its premium credit cards, travel services, and expansive merchant network. It serves affluent consumers, small businesses, and corporate clients through charge and credit cards, lending, and travel-related offerings. The company’s closed-loop network, where it issues cards, processes transactions, and acquires merchants, provides rich data on consumer and business spending trends. Amex is especially strong in the premium segment, catering to high-income customers who spend roughly three times more than the average cardholder, offering insights into discretionary spending, global travel demand, and broader consumer confidence. AXP posted record quarterly revenue of $18.4B (+11% YoY) and EPS of $4.14 (+19%). The refreshed US Platinum Card drove a surge in new accounts (2x pre-launch levels) and strong engagement across retail (+12%) and travel (+14% in premium airfare). Millennials and Gen-Z now represent 36% of spend, transacting 25% more than older cohorts. Credit quality remained pristine, with delinquencies still below 2019 levels. International spend rose 13% FX-adjusted, and non-US Platinum volumes climbed 24%, signaling durable global demand. The stock rose 7.2% on 10/17 in reaction to better-than-expected results…
Continue reading our Conference Call Recap for AXP by becoming a Bespoke Institutional subscriber. You can sign up for Bespoke Institutional now and receive a 14-day trial to read our newest Conference Call Recap. To sign up, choose either the monthly or annual checkout link below:
Q3 2025 Earnings Conference Call Recaps: Interactive Brokers (IBKR)
Bespoke’s Conference Call Recaps use AI to summarize lengthy earnings calls. The commentary below is AI-generated and then edited by Bespoke for quality control. As always, none of these summaries should be construed as recommendations to buy or sell any securities, and investors should do their own research and/or consult with a financial professional before making any investment decisions.
Our latest recap available to Bespoke subscribers covers Interactive Brokers’ (IBKR) Q3 2025 earnings call.
![]()
Interactive Brokers Group (IBKR) is a global electronic brokerage firm offering direct-access trading and clearing services. With operations spanning over 160 markets and more than 3 million accounts globally, it serves individual investors, prop traders, advisors, and hedge funds. Offering products such as overnight global trading, forecast contracts and crypto solutions, IBKR gives insight into the intersection of retail and institutional trading, macro flows and technology-driven brokerage trends. In Q3, IBKR delivered net revenues up 21%, client equity rising 40% YoY and new accounts topping 790k to push total accounts past 4 million. The firm benefitted from a favorable interest-rate backdrop, yet warned that each 25 bp cut in Fed funds could reduce annual net interest income by about $77 million. Securities-lending and margin balances grew strongly, driven by short activity, M&A/IPO catalysts and leverage appetite. The crypto business surged (volumes up 87% QoQ and 5x YoY), with European rollout via partner Zero Hash and stable-coin funding in motion. IBKR also advanced its tech-platform strategy via AI-powered tools (“Connections”, “Investment Themes”) and expanded its prediction-market product set (ForecastEx). The stock fell 3.3% despite stronger EPS and revenue than estimates…
Continue reading our Conference Call Recap for IBKR by becoming a Bespoke Institutional subscriber. You can sign up for Bespoke Institutional now and receive a 14-day trial to read our newest Conference Call Recap. To sign up, choose either the monthly or annual checkout link below:
S&P 500 and Gold Volatility Traits
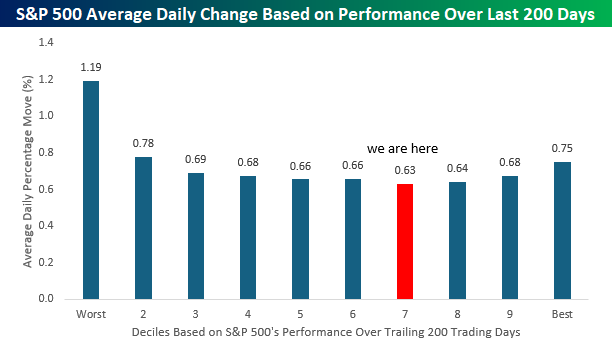
When it comes to the stock market, investors quickly learn of the inverse relationship between performance and volatility. When prices rise, the VIX usually declines, and when the VIX surges as it did back in April, or any other market emergency, stocks crater. The chart below illustrates that relationship. In it, we grouped every 200-trading day window of the S&P 500 since 1975 into deciles based on the index’s performance during those periods. The weakest periods were grouped into decile one while the best 200-day periods went into decile ten. For each of those periods, we then calculated the S&P 500’s average absolute daily move.
The S&P 500’s average absolute daily move during its worst 200-day trading periods was 1.19%, and just experiencing the weakness of April, that makes perfect sense. More interestingly, outside of decile one, the average daily move immediately plummets to 0.78% in decile two, and from there, it remains at or around that level (at least relative to the 1.19% level from decile one) for every decile out to ten. For the current environment, we’re currently in decile seven where the average daily move is lower than any other decile.
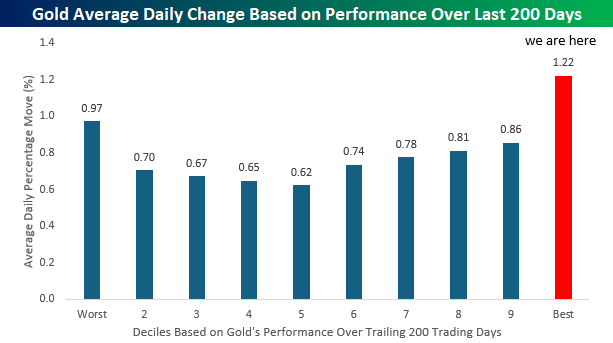
While there’s an inverse relationship between the S&P 500’s performance and volatility, for gold, it’s nearly the opposite. The chart below shows the same analysis for gold. While gold has also historically been volatile during periods when its performance has been the weakest, the strongest returns have historically come during periods when its trailing 200-day performance has been the strongest. During the strongest 200-day periods for gold since 1975, its average daily move has been +/-1.22%, or 25 basis points more than any other decile. Maybe not what you would expect, but for gold to be an uncorrelated asset, when stocks go crazy in one direction, it should go crazy in the opposite way. What makes the current period interesting is that while the S&P 500 falls into decile seven in terms of its trailing 200-day performance, gold’s performance over the last 200 trading days ranks among the best on record since 1975. In other words, they’ve actually been correlated assets so far this year!
Bespoke’s Morning Lineup – 10/20/25 – Unchanged Since the Shutdown
See what’s driving market performance around the world in today’s Morning Lineup. Bespoke’s Morning Lineup is the best way to start your trading day. Read it now by starting a two-week trial to Bespoke Premium. CLICK HERE to learn more and start your trial.
“It’s unbelievable how much you don’t know about the game you’ve been playing all your life.” – Mickey Mantle
Below is a snippet of commentary from today’s Morning Lineup. Start a two-week trial to Bespoke Premium to view the full report.
The government remains shut down this morning as the stalemate between the two parties nears the start of its fourth week. As has been the case nearly the entire time, though, the markets seem indifferent as the S&P 500 will open today pretty much right where it was when the shutdown started. Interest rates are little changed this morning as the 10-year yield remains right at 4%. Crude oil is trading about 1% lower, right at $57 per barrel, and as has been the case for seemingly every day, gold prices are 1.5% higher, but still over 2% off record highs after Friday’s sharp reversal lower. Along with higher gold prices, crypto is also strong this morning with Bitcoin back above $110K and Ethereum back above $4,000. There’s not much economic data due to the shutdown, but the pace of earnings this week will really fill the void.
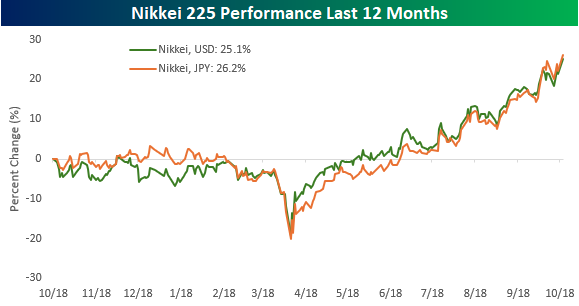
In Asia overnight, Japan surged more than 3% to new record highs after the LDP and Innovation Party agreed to form a coalition government, paving the way for Takaichi to become Prime Minister effective tomorrow. Elsewhere in the region, Chinese GDP rose more than expected, while Unemployment in Hong Kong rose more than expected.
Japan’s rally overnight pushed the index’s ‘marathon’ gain over the last 12 months to 26.2% in local currency terms, and interestingly enough, for all the fluctuations in global currencies this year, the dollar and yen haven’t moved much relative to each other, so on a dollar-adjusted basis, the Nikkei is up slightly less at 25.1%.
European markets aren’t as strong as Asia this morning, but they have a positive bias nonetheless. The STOXX 600 is up 0.6% to start the week. The CAC-40 is the only major benchmark not in the green as S&P lowered the country’s credit rating and an adverse legal ruling against BNP Paribas has that stock trading down over 5%.
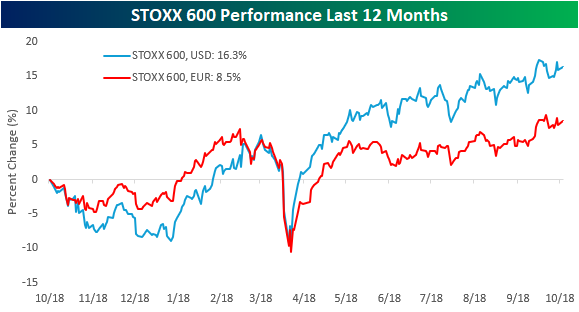
Not only is Europe up less than Japan in early trading today, but the STOXX 600 is also lagging over the last year. As shown in the chart below, on a local-currency basis, Europe’s benchmark index is up a relatively modest 8.5% and trading just shy of new highs. After accounting for the weakness in the dollar this year relative to the dollar, though, it’s up nearly twice that at 16.3%. Depending on which side of the Atlantic you’re on, the performance of European stocks looks a lot different.
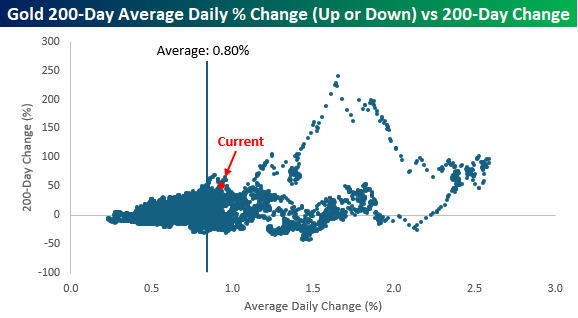
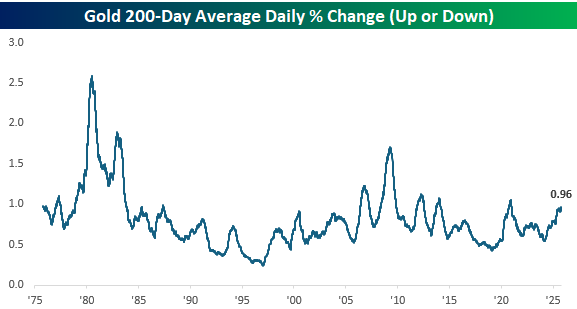
The weakness in the dollar against currencies like the euro has helped to drive the rally in gold, but in addition to being so strong lately, gold has also been volatile. Over the last 200 trading days, gold’s average daily move has been just under 1% which is the most volatility over a trailing 200-day period since Covid, but nowhere near historical extremes like we saw in the 1980s.
In the equity markets, volatility and large daily moves tend to occur during periods of market weakness, but for gold, that hasn’t necessarily been the case. In periods when gold has rallied 30%+ in 200 days, its average daily change was 1.27% whereas in all other periods, its average daily change was much less at just 0.76%.