What Volatility?
October is winding down, and while investors braced for volatility this month, they got off relatively easy. From its MTD high (at the time) on 10/9 to its intraday low on 10/10, the S&P 500’s maximum drawdown from a high was 3.16%, While last October’s maximum drawdown of 2.99% was smaller, this month’s max decline was 1.44 percentage points less than the median maximum drawdown of 4.60% seen during the month dating back to 1983, which is as far back as we have intraday price history for the S&P 500.
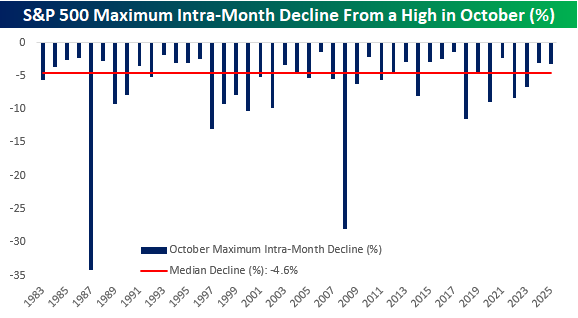
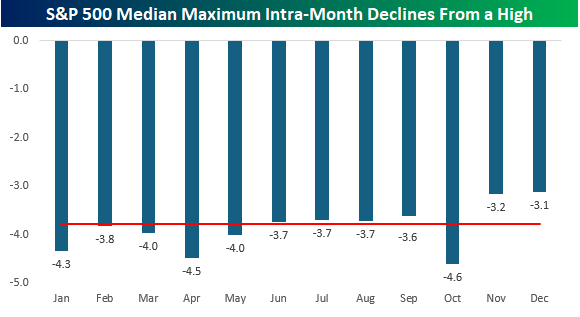
October is known as the most volatile month, and history backs that up. As shown in the chart below, no other month has experienced a larger median maximum drawdown. Somewhat surprisingly, though, April at -4.5% and January at -4.3% aren’t far behind. What makes the month seem even more volatile than it is, though, is that for anyone who has been around a while, two of the three largest intra-month drawdowns from a high have both occurred in October. In 1987, the S&P 500 declined by more than 34% from peak to trough, while in 2008, it plunged by 28%. The only other months with an intra-month decline of more than 25% were March 2020 (-30.12%) when Covid shut down the economy and November 2008 (-26.45%) during the Financial Crisis. It isn’t always a crazy month, but when it is, October sure knows how to disappoint!
Not a Bespoke client? We’d love for you to give our equity research platform, Bespoke Premium, a try. You can sign up for complimentary access for 14 days at this link to start receiving our daily emails today!

The Triple Play Report — 10/31/25
An earnings triple play is a stock that reports earnings and manages to 1) beat analyst EPS estimates, 2) beat analyst sales estimates, and 3) raise forward guidance. You can read more about “triple plays” at Investopedia.com where they’ve given Bespoke credit for popularizing the term. We like triple plays as an indication that a company’s business is firing on all cylinders, with better-than-expected results and an improving outlook. A triple play is indicative of positive “fundamental momentum” instead of pure fundamentals, and there are always plenty of names with both high and low valuations on our quarterly list.
Bespoke’s Triple Play Report highlights companies that have recently reported earnings triple plays, and it features commentary from management on triple-play conference calls, company descriptions and analysis, and price charts. Bespoke’s Triple Play Report is available at the Bespoke Institutional level only. You can sign up for Bespoke Institutional now and receive a 14-day trial to read this week’s Triple Play Report, which features 20 new stocks. To sign up, choose either the monthly or annual checkout link below:
Bespoke Institutional – Monthly Payment Plan
Bespoke Institutional – Annual Payment Plan
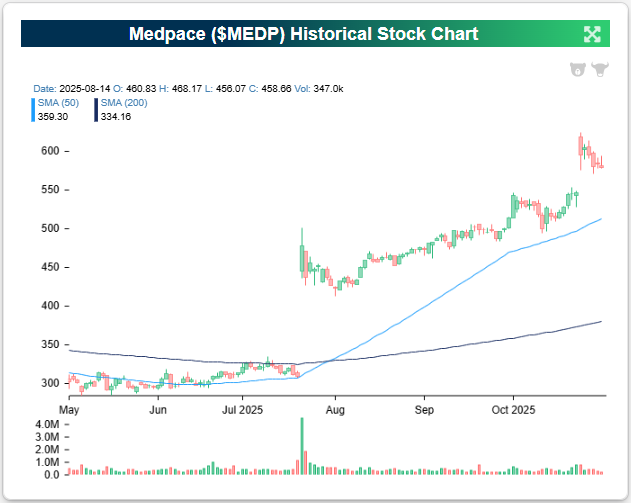
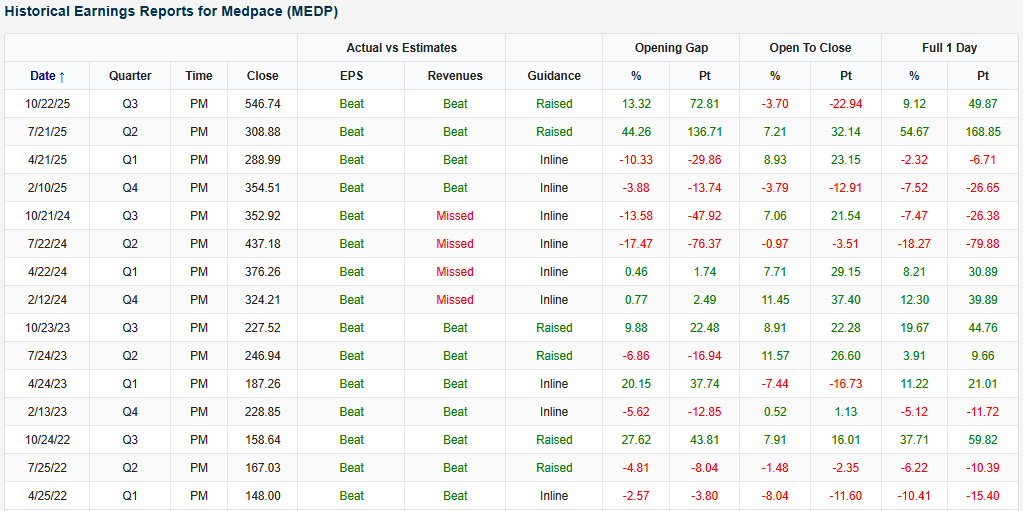
Medpace (MEDP) is an example of a company that recently reported an earnings triple play after the close on 10/22. MEDP reported its second straight triple play, and the stock was up 9.1% on 10/23. After the previous quarter’s triple play report, the stock skyrocketed 54.7%! It hit another all-time high after its latest triple play and is up 74.7% YTD.
Here’s how AI describes the company: Medpace (MEDP) is a global clinical research company that helps biotech and pharmaceutical firms bring new drugs to market by managing every stage of the clinical trial process. The company handles trial design, patient recruitment, site coordination, data analysis, and regulatory submissions under one roof, which gives it tight control over quality and timing. Its work spans a range of therapeutic areas but has become especially concentrated in metabolic disease, oncology, and cardiovascular trials, with a growing portion of business tied to obesity and GLP-1 drug development. A large part of its future revenue comes from its “backlog” of awarded projects that have yet to start, giving strong visibility into client demand.
Medpace’s quarter showed how it is benefiting from the surge in obesity and metabolic disease drug development, which has become one of the hottest areas in biotech. Revenue climbed 23.7% to $659.9 million as the company managed a growing volume of late-stage GLP-1 studies, which are larger, faster-paced, and more expensive to run because of high site and investigator costs. After several quarters of disruption from study cancellations, management said the environment has improved sharply, with fewer cancellations and more consistent client funding. That allowed the value of awarded but not-yet-launched projects to grow 30% from last year, positioning the company for continued growth as those trials move into active enrollment. Hiring was strongest in the US, where most GLP-1 trials are based, and India remains a key location for back-office and data work as Medpace scales up to meet record demand.
Looking at the snapshot below from our Earnings Explorer, Medpace (MEDP) has started to find its footing again after hitting somewhat of a rough stretch in 2024, headlined by revenue misses and heavy declines for the stock after reporting. In the last year, though, MEDP has been consistent with EPS and revenue beats, and with two recent triple plays, investors are coming back around to the stock. Historically speaking, MEDP has been a reliable earnings bet against estimates, with EPS and revenue beat rates going back to 2016 of 89% and 78%, respectively, which are both meaningfully above average.
You can read more about MEDP and the 21 other triple plays we covered in our newest report by starting a Bespoke Institutional trial today.
Bespoke Investment Group, LLC believes all information contained in these reports to be accurate, but we do not guarantee its accuracy. None of the information in these reports or any opinions expressed constitutes a solicitation of the purchase or sale of any securities or commodities. This is not personalized advice. Investors should do their own research and/or work with an investment professional when making portfolio decisions. As always, past performance of any investment is not a guarantee of future results. Bespoke representatives or clients may have positions in securities discussed or mentioned in its published content.
Bespoke’s Morning Lineup – 10/31/25 – No Scares From the Mega Caps
See what’s driving market performance around the world in today’s Morning Lineup. Bespoke’s Morning Lineup is the best way to start your trading day. Read it now by starting a two-week trial to Bespoke Premium. CLICK HERE to learn more and start your trial.
“The work of today is the history of tomorrow and we are its makers” – Juliette Gordon Low

Below is a snippet of commentary from today’s Morning Lineup. Start a two-week trial to Bespoke Premium to view the full report.
To view yesterday’s CNBC interview talking about market breadth, click on the image below.
The S&P 500 heads into today with just fractional gains for the week, but today’s trading should add to those gains with futures indicated 0.7% higher. Strong earnings from the mega-caps are to thank for the gains, as what has already been a positive earnings season continues. Outside of equities, treasury yields are slightly higher, while crude oil trades slightly lower but has hung on to $60 per barrel for now. Metals prices are mixed as gold hangs on to $4,000 while silver and copper are essentially unchanged. Crypto is showing some life as Bitcoin trades higher by 3% and Ethereum rallies closer to 5%.
In Asia overnight, markets were mixed. Japan, China, and South Korea all closed out the week higher and with solid gains for the week, but Hong Kong and India were both lower. The biggest economic datapoints of the session were PMI readings in China as the Manufacturing index slid further into contraction territory while the Services component barely stayed out of contraction (50.1).
In Europe, there’s another negative bias with the STOXX 600 down 0.4% as an index of inflation expectations showed a modest uptick from 2.0% to 2.1% for 2025. It wasn’t all bad news, though, as 2025 GDP growth forecasts also showed a modest uptick from 1.1% to a still anemic 1.2%. The higher inflation expectations were also accompanied by an uptick in headline CPI to 0.2% m/m from September’s rate of 0.1%.
Apple (AAPL) and Amazon.com (AMZN) rounded out the group of mega-caps reporting this week with earnings releases after the bell Thursday. Shares of Apple (AAPL) are poised to gap up over 2% at the open, but the real standout is Amazon.com (AMZN). While investors worried that the company’s layoff announcement earlier in the week was a precursor to a weak report, AMZN eased those fears with strong numbers across the board, and in response, shares spiked more than 10%.
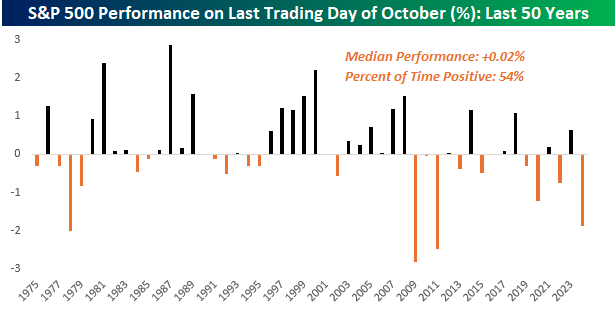
Today is Halloween and the last trading day of October, so can investors expect a trick or a treat? Over the last 50 years, it’s been a bit of a coin flip. As shown in the chart below, the S&P 500’s median performance on the last trading day of October has been a gain of 0.02% with positive returns 54% of the time. In terms of volatility, the median absolute daily change on these days has been 0.50%.
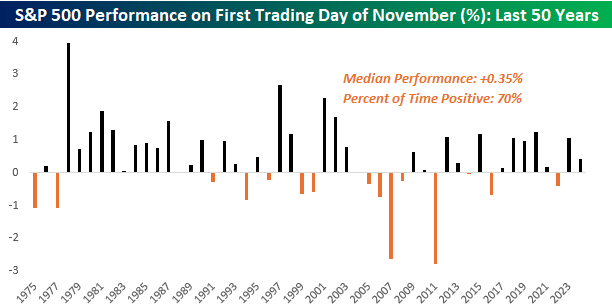
While the last day of October has been relatively uneventful in terms of returns, November typically starts on a more positive note. Over the last 50 years, the S&P 500’s median gain has been 0.35% with gains 70% of the time. And while October is a month known for its volatility, with a median absolute daily change of 0.77%, the first trading day of November has been more volatile than the last day of October.
The Closer – AI Leverage, Hindenburg, Housing – 10/30/25
Log-in here if you’re a member with access to the Closer.
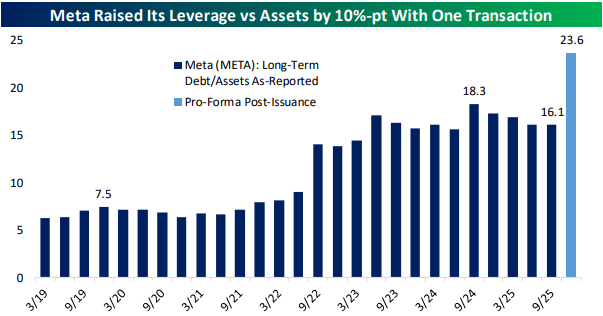
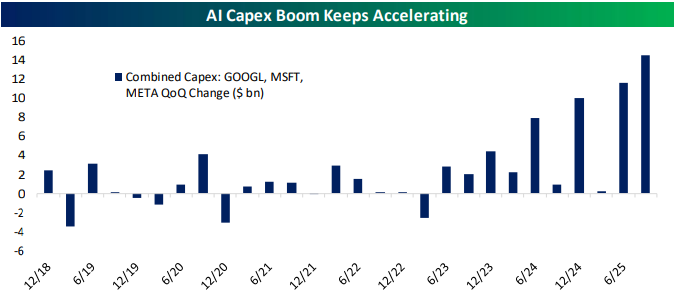
Looking for deeper insight into markets? In tonight’s Closer sent to Bespoke Institutional clients, we kick off with a note of Meta (META) making a monster bond offering (page 1) in addition to other AI related credit market insights (page 2). We then review the triggering of the Hindenburg Indicator (page 3) followed by a recap of the latest earnings (pages 3 and 4). We cap off with a dive into the latest housing inventory data (pages 5 and 6).
See today’s full post-market Closer and everything else Bespoke publishes by starting a 14-day trial to Bespoke Institutional today!
Chart of the Day: Purr-Fect Performance
Bespoke’s Morning Lineup – 10/30/25 – Muted
See what’s driving market performance around the world in today’s Morning Lineup. Bespoke’s Morning Lineup is the best way to start your trading day. Read it now by starting a two-week trial to Bespoke Premium. CLICK HERE to learn more and start your trial.
“And so we always say we’re not on a preset path, and we really mean that.” – Jerome Powell
Below is a snippet of commentary from today’s Morning Lineup. Start a two-week trial to Bespoke Premium to view the full report.
Futures are lower this morning with the S&P 500 and Nasdaq both indicated to open moderately lower from yesterday’s close as investors continue to digest Powell’s hawkish comments from yesterday. The weakness also follows a slew of earnings reports, including the behemoths of Alphabet (GOOGL), Meta (META), and Microsoft (MSFT). The reaction from the market to those three has been somewhat of a draw, with GOOGL up sharply, META down sharply, and MSFT only modestly lower. The fun continues tonight with just as many reports, including Amazon.com (AMZN) and Apple (AAPL) after the bell. After that, we’ll be through the peak of earnings season, at least in terms of market cap, so Congress better get the government open again, so there can be some economic data to focus on!
In Asia, there was no shortage of headlines with Presidents Trump and Xi meeting in South Korea. While the two leaders reached a 1-year détente on trade with Trump reducing fentanyl tariffs to 10%, China agreed to keep the flow of rare earth materials going and announced plans to purchase soybeans, energy, and other farm products. President Trump also said he plans to visit China in April. Despite all the headlines, though, it was a quiet session as most indices in the region were modestly lower. Of course, South Korea bucked the trend, though, with a gain of 0.1% as the KOSPI remains seemingly unstoppable.
In European trading this morning, stocks are decidedly lower. The STOXX 600 is down 0.5% as Spain leads the way lower with a decline of just over 1%, while Germany outperforms, even as it faces a decline of 0.1%. GDP growth for the region was above expectations (0.2% vs 0.1%), as growth in France led the region. The underperformance from Spain, however, stems from a higher-than-expected inflation print as y/y CPI increased 3.1% versus expectations for an increase of 2.9%.
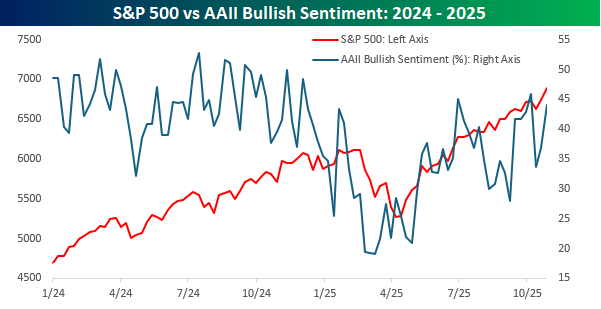
As US equities continue to march to new record highs, individual investor sentiment got a boost this week as the weekly survey from AAII showed that bullish sentiment increased from 36.9% to 44.0% for the highest reading in three weeks. While you would expect bullish sentiment to rise, current levels of optimism are nowhere near where they were at this point last year.
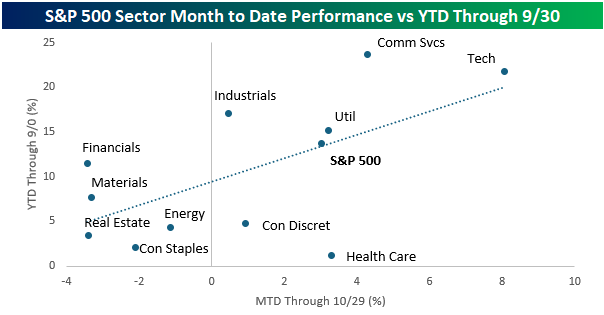
Perhaps one reason investors are less optimistic is due to the government shutdown, which has lasted nearly a month. With the S&P 500 up over 3% this month, it doesn’t appear as though the market is all that concerned, but looking at sector performance, there have been some shifts this month. The chart below compares sector performance so far in October (period covering the shutdown) on the x-axis to sector performance in the first nine months of the year (y-axis).
While sectors like Technology, Utilities, Energy, Real Estate, Materials, and Consumer Staples have stayed relatively close to the trendline, indicating that their YTD trend has remained largely intact this month, sectors like Communication Services, Health Care, Consumer Discretionary, Industrials, and Financials have seen their performance trend this month deviate significantly from their YTD trend in the first nine months of the year. That doesn’t necessarily mean that the shutdown has had a direct impact on these sectors’ performance, but their YTD trends have shifted.
The Closer – A Hawkish Fed, Mega-Cap Earnings, Equal Weight – 10/29/25
Log-in here if you’re a member with access to the Closer.
Looking for deeper insight into markets? In tonight’s Closer sent to Bespoke Institutional clients, we begin with a rundown of today’s FOMC meeting including an evaluation of Powell’s comments in addition to CBO forecasts of the effects of the government shutdown (page 1). We then switch over to a rundown of the latest earnings including results of the first mega-caps like Alphabet (GOOGL), Meta (META), Microsoft (MSFT), and more (pages 2 and 3). We then finish with an update on the changing trends for intraday trading on Fed days and the massive underperformance of equal weight equities over the past couple of sessions (page 4).
See today’s full post-market Closer and everything else Bespoke publishes by starting a 14-day trial to Bespoke Institutional today!
Chart of the Day – Where Are All the Overbought Stocks?
“Mega” Outperformance
We’ve highlighted the weak breadth in the market for clients for the last several days now, and this afternoon, we wanted to provide another example to add to the growing list. Let’s start with the straight-up performance of the market-cap-weighted S&P 500 (SPY) versus its equal-weighted counterpart (RSP). For the first few months of the year, both indices performed right in line with each other. On a YTD basis, the two had equal returns as late as mid-June, but the equal-weighted index took the summer off and appears like it’s still out on vacation. As the chart below illustrates, the gap between the two indices has been widening for the last four months, with a real acceleration in the last few trading days as SPY has continued higher while RSP has traded lower.
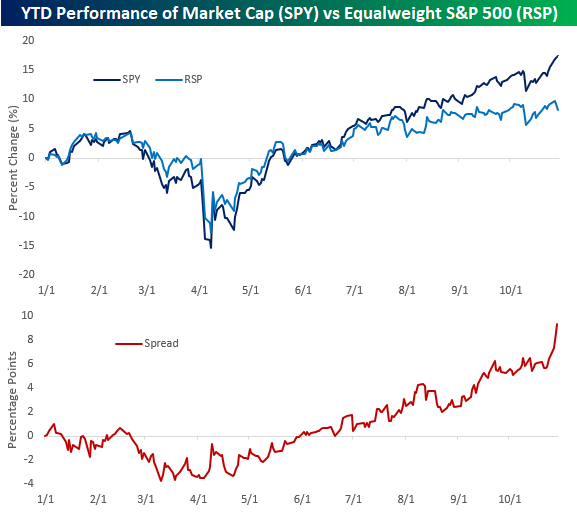
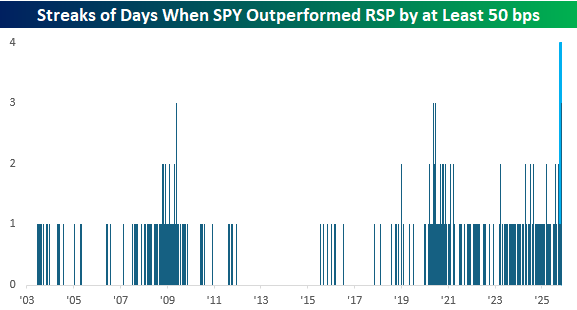
The performance gap has been so wide in the last week, that RSP has underperformed SPY by more than three percentage points. It hasn’t been just a one or two-day move either; through this afternoon, SPY is on pace to outperform RSP by at least 0.5% for the fourth straight day. Since RSP’s launch in 2003, there has never been a streak that long.
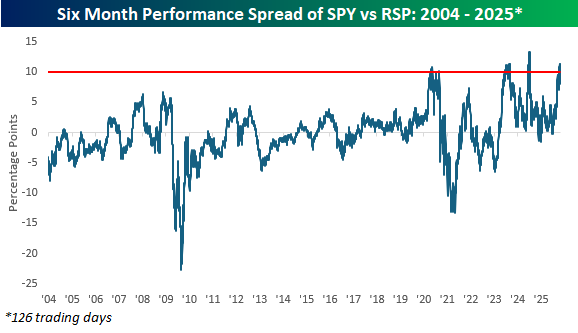
While the performance gap between SPY and RSP has been extremely wide, it hasn’t yet reached a historical extreme. The keyword here is “yet.” Over the last six months, SPY has outperformed RSP by just over 11 percentage points. This marks the fourth time that SPY has outperformed RSP by more than 10 percentage points over a six-month span. The three prior periods of massive SPY outperformance all occurred post-COVID, and the only other times the spread got wider were briefly in August 2023 and July 2024.
Eventually this outperformance of SPY over RSP will reverse; it’s just a matter of when. It will be interesting to see how the mega-caps trade in reaction to earnings reports, which for many will hit the tape tonight and tomorrow. Will earnings be a “sell-the-news” catalyst for the mega-caps? We’ll find out shortly.
Not a Bespoke client? We’d love for you to give our equity research platform, Bespoke Premium, a try. You can sign up for complimentary access for 14 days at this link to start receiving our daily emails today!
Bespoke’s Morning Lineup – 10/29/25 – Anticipation Builds
See what’s driving market performance around the world in today’s Morning Lineup. Bespoke’s Morning Lineup is the best way to start your trading day. Read it now by starting a two-week trial to Bespoke Premium. CLICK HERE to learn more and start your trial.
“People don’t care about what you say, they care about what you build.” – Mark Zuckerberg
Below is a snippet of commentary from today’s Morning Lineup. Start a two-week trial to Bespoke Premium to view the full report.
It’s a day that doesn’t begin with “S” which these days means that stocks are poised to open higher with the S&P 500 indicated to open up 0.25% while the Nasdaq looks likely to gap up 0.43% at the open ahead of what will be a big day for earnings as three of the megacaps – Microsoft (MSFT), Alphabet (GOOGL), and Meta (META) – will report after the close. Also, don’t forget today’s Fed decision at 2 PM Eastern.
With equities indicated higher, treasury yields have also moved higher, but at 3.99%, the 10-year yield remains below 4%. Crude oil prices are slightly higher, while gold has rallied more than 1%, moving back above $4,000 per ounce.
In Asia, most indices were higher as positive headlines emerged from the President’s trip to the region. Consumer sentiment in Japan came in higher than expected, but inflation in Australia came in unexpectedly high. All eyes in the region will now shift to tomorrow’s meeting between President Trump and Chinese President Xi after headlines this morning suggest that China has already placed soybean orders with American farmers, while the US is likely to reduce fentanyl-related tariffs. The positive tone in Asia made its way over to Europe as the STOXX 600 rallies 0.3% with the UK and Spain up more than twice that.
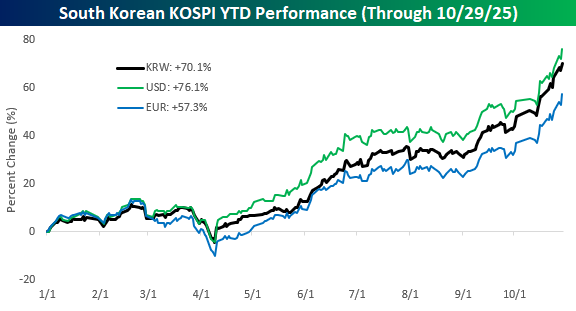
With Asian stocks mostly higher overnight, South Korea, after announcing a trade deal with the US, saw the KOSPI rally 1.8% to another in what has been a string of recent record highs. For the year, the KOSPI has now rallied more than 70%, which pretty much outdoes every other major stock market around the world on a YTD basis. Not only has the KOSPI rallied, but with its currency rallying against the dollar this year, from the perspective of a US investor, the gains are even greater at 76.1%. Even in euro terms, South Korean stocks are up over 57%!
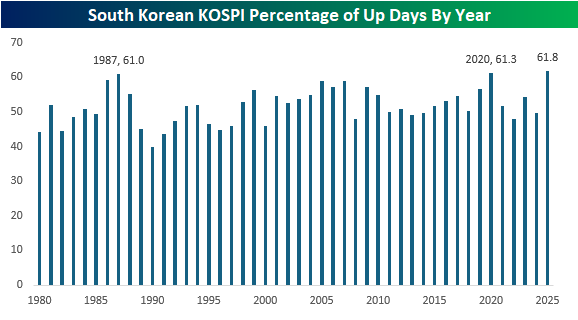
The gains in the KOSPI have also been consistent. Through last night’s close, the index traded higher on nearly 62% of all trading days, putting it on pace for the highest percentage of up days in a year on record. The only two other years when up days exceeded 60% were 1987 (61.0%) and 2020 (61.3%).
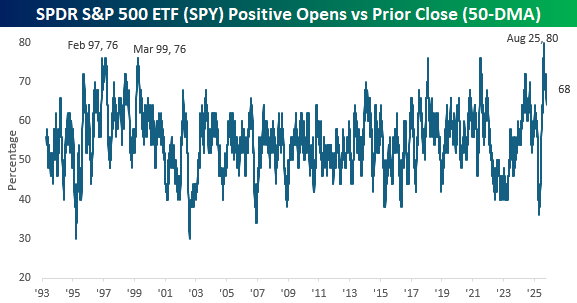
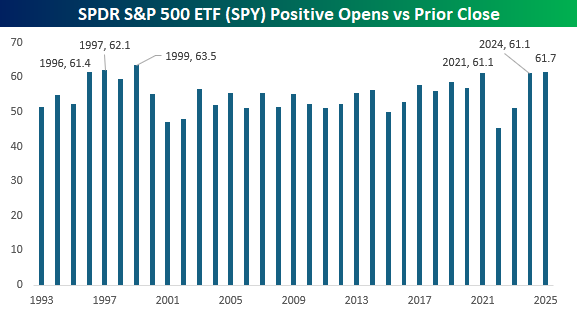
In the US, where we’ve seen strength this year has been at the opening bell. Just like today, the SPDR S&P 500 ETF (SPY) has gapped up at the open on 61.7% of all trading days. Since its inception, the only years with a higher percentage of positive gaps were 1999 (63.5%) and 1997 (62.1%), while 1996, 2021, and 2024 were the only three other years when SPY gapped up at the open more than 60% of the time.
Much of the strength in SPY at the opening bell has come more recently since the tariff-tantrum. Over the last 50 trading days, SPY has gapped up at the open on more than two-thirds of trading days, and back in August, that percentage spiked up to a record high of 80%, exceeding the twin peaks of 76% from February 1997 and March 1999. What makes the current spike even more unique is the fact that it immediately followed a period of extreme selling at the open. Just as recently as this Spring, SPY gapped down on nearly two-thirds of all trading days, which was the lowest reading since December 2006.