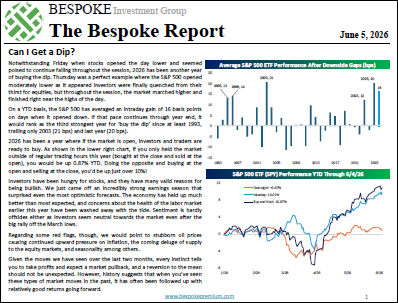
The Bespoke Report – 6/5/26 – Can I Get a Dip?
To read our weekly Bespoke Report newsletter and access everything else Bespoke’s research platform offers, choose one of our three member plans today!
This week’s report covers all you need to know about the market this week, including historic moves in major indices and an insatiable demand for equities. Give it a read!

Another $1+ Trillion Club Member: VOO
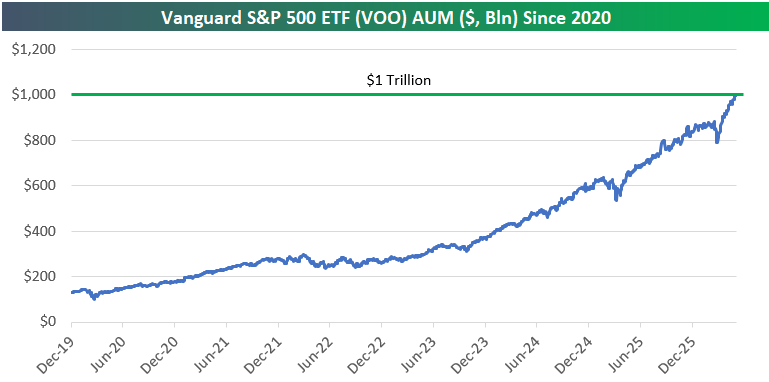
Along with the now double-digit number of individual stocks with market caps exceeding $1 trillion, an ETF has joined the trillion-dollar club: VOO.
The Vanguard S&P 500 ETF (VOO), which allows investors to own the entirety of the S&P 500, had less than $200 billion in assets under management (AUM) as recently as 2021, but this week, VOO’s AUM crossed above $1 trillion for the first time in history.
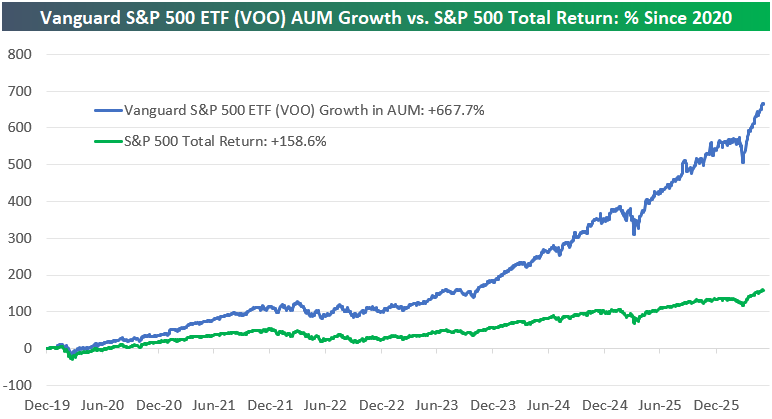
As shown below, while the S&P 500 has returned 158.6% since the start of 2020, VOO — an ETF that tracks the index — has seen AUM grow by 667.7%.
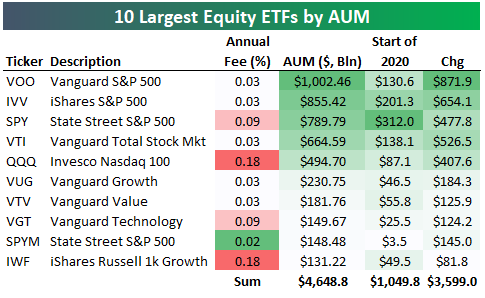
Below is a list of the ten largest equity ETFs traded on US exchanges. The Vanguard S&P 500 ETF (VOO) ranks at the top of the list, followed by the iShares S&P 500 ETF (IVV) at $855.4 billion, then the State Street S&P 500 ETF (SPY) at $789.8 billion.
As most seasoned investors know, SPY was the first-ever US ETF that began trading in 1993, but its 0.09% annual fee has kept it from remaining on top when it comes to AUM. Both VOO and IVV charge just 3 basis points (0.03%) per year. To compete, State Street also offers SPYM, which has a fee that’s one basis point less than the 0.03% charged by VOO and IVV, but SPYM AUM currently sits at $148.5 billion.
Combined, the ten largest equity ETFs now have $4.65 trillion in AUM, up $3.6 trillion since the start of 2020.
With the July 4th holiday coming up, make sure to pick up one (or two or three) of our fun t-shirts or sweatshirts to wear for the 250th. You can find them at Bespoke Threads or an even wider selection at our Task Force 250 store.

Want more from Bespoke? You can start by joining our Think BIG mailing list where you’ll receive an interesting market stat in your inbox a few times per week. All we need is your email address. Join now by clicking here or on the image below.

Bespoke’s Morning Lineup – 6/5/26 – Weak End into the Weekend
See what’s driving market performance around the world in today’s Morning Lineup. Bespoke’s Morning Lineup is the best way to start your trading day. Read it now by starting a two-week trial to Bespoke Premium. CLICK HERE to learn more and start your trial.
“Inspiration usually comes during work, rather than before it.” – Madeleine L’Engle

Below is a snippet of commentary from today’s Morning Lineup. Start a two-week trial to Bespoke Premium to view the full report.
It’s already been a busy week for employment-related news, and most of it has been good. This morning’s labor report will trump all the other reports and help dictate the direction of the markets heading into the weekend and whether the current streak of weekly gains extends to double digits. Wherever the report comes in, though, remember that it is only one snapshot of a much larger mosaic. Odds are it will be revised multiple times over the next several months (years).
Heading into the last session of the week, equity futures are mostly lower. The Nasdaq is indicated to gap down more than 1%, while S&P 500 futures point to a 0.5% decline, and the Dow is indicated slightly higher. If all of this sounds familiar, it’s because the setup was the same yesterday. There are not really any catalysts to blame for the weakness, except that investors are growing increasingly apprehensive about putting new money to work after the massive tech rally and a coming avalanche of supply.
Outside of equities, treasury yields are modestly lower, with the 10-year yielding just below 4.47%. Oil is slightly higher with WTI at $93.25 per barrel as prospects of a peace deal with Iran continue to dangle just over the horizon that we can never seem to reach. Gold is slightly lower, and Bitcoin is down another 2% and approaching $62K.
In Asia, markets closed out a mostly negative week on a down note, with the Nikkei and Hong Kong falling over 1% while South Korea plunged 5%. In Europe, markets are moving in the other direction. The STOXX 600 is up 0.3%, led higher by Spain, which is up 1%. The gains come despite Q1 GDP being revised from growth of 0.1% to a contraction of 0.2%. That was the first negative quarter for the region since 2021.
Besides the declines in Asian stocks overnight, the Japanese yen and South Korean won have been weak. Just weeks after the BoJ intervened in the market to defend the currency, the yen has resumed its slide, pushing towards a psychologically important level of 160 versus the dollar. In South Korea, the won has shown steady weakness against the dollar for over a year now (rising line in chart), and just last night traded at its weakest level versus the dollar since 2009.
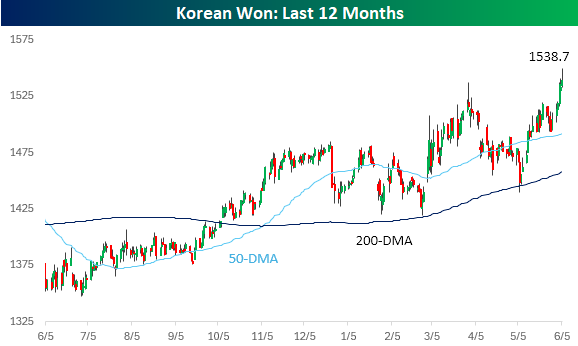
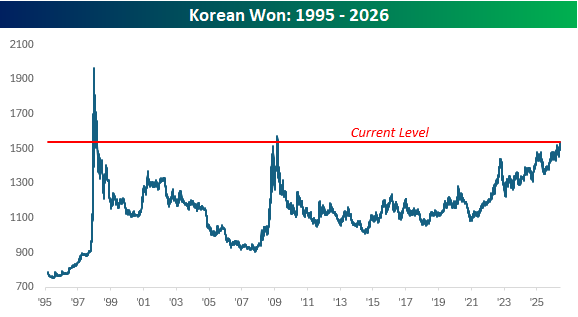
Many comparisons have been made between the current market environment and the late 1990s, and weakness in Asian currencies can just be added to the list. In 1997, we had the Asian currency crisis, which spawned a global market sell-off, so it’s only natural to raise an eyebrow when you see headlines about the South Korean won hitting multi-year lows versus the dollar.
A look at the long-term chart for the won, however, shows that at this point, the decline looks nothing like the weakness we saw in 1997 and 2008. In both of those periods, the weakness went parabolic, whereas the current period of weakness has been a steadier grind. If the slope of the line starts to steepen, though, put on your seatbelt.
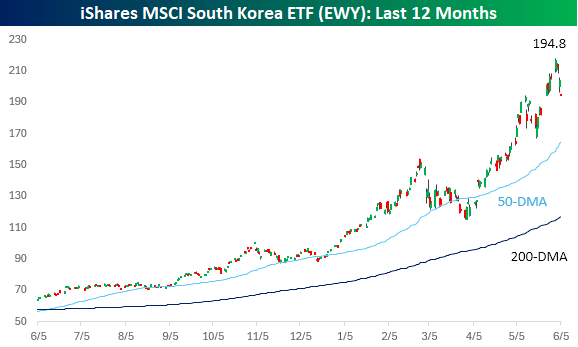
While the won has been weakening, the rate of decline hasn’t been nearly fast enough to offset the rabid gains in the South Korean equity market. Over the last year, the iShares MSCI South Korea ETF (EWY) has more than tripled, rising from around $60 to over $200 earlier this week, and just under $195 in pre-market trading today. At these levels, EWY is holding right at the levels it was after its gap higher in late May after the Memorial Day weekend. If these levels can hold, the recent pullback will look benign, but even after this pullback, prices remain extremely elevated.
Start a two-week trial to Bespoke Premium to continue reading today’s full Morning Lineup.
The Closer – Vol vs. Momentum, AI Contribution, Housing – 6/4/26
Log-in here if you’re a member with access to the Closer.
- Low volatility stocks have experienced historic underperformed recently whereas momentum has outperformed massively.
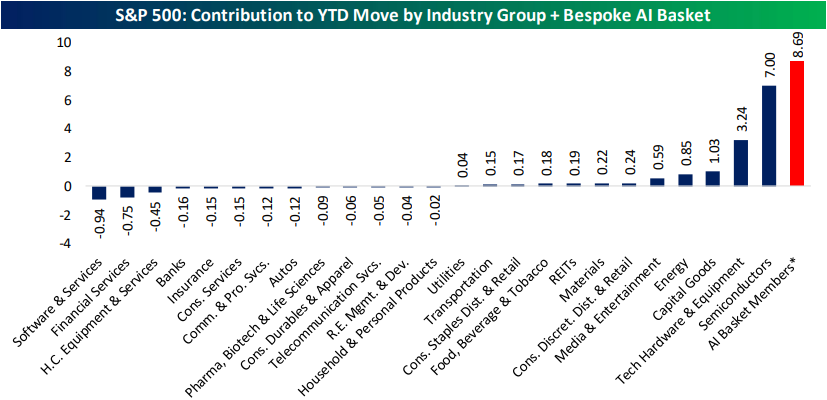
- Tech industries, or more specifically the AI trade, is to thank for a vast majority of YTD gains.
- Home listing prices are down to the lowest level since April 2022 as inventories have risen.
See today’s full post-market Closer and everything else Bespoke publishes by starting a 14-day trial to Bespoke Institutional today!
Chart of the Day: Buying The Biggest
B.I.G. Tips – Earnings Triple Plays Recap: Q1 2026
During the recently-completed Q1 2026 earnings reporting period, there were a total of 184 earnings triple plays out of just over 1,800 individual quarterly earnings reports from US-listed stocks. That’s 86 more than the 98 triple plays we saw during the prior earnings reporting period and 106 more than the 78 reported this time a year ago.
What is a triple play? When a stock reports quarterly earnings, it registers a “triple play” when it beats analyst EPS estimates, beats analyst revenue estimates, and raises forward guidance. We coined the term back in the mid-2000s, and you can read more about it at Investopedia.com. We consider triple plays to be the cream of the crop of earnings season, and we’re constantly finding new long-term opportunities from this basket of names each quarter. You can track the newest earnings triple plays on a daily basis at our Triple Plays page if you’re a Bespoke Premium or Bespoke Institutional member.
To read our quarterly triple play recap and see some of the triple plays with intriguing price charts at the moment, start a two-week trial to Bespoke Premium!
Bespoke’s Morning Lineup – 6/4/26 – Reality Check
See what’s driving market performance around the world in today’s Morning Lineup. Bespoke’s Morning Lineup is the best way to start your trading day. Read it now by starting a two-week trial to Bespoke Premium. CLICK HERE to learn more and start your trial.
“A good first impression can work wonders.” – J.K. Rowling
Below is a snippet of commentary from today’s Morning Lineup. Start a two-week trial to Bespoke Premium to view the full report.
Markets are getting a bit of a reality check this morning as Nasdaq futures are down over 1%, while S&P 500 futures look at a more modest decline of 0.4%. The weakness comes despite crude oil prices trading down over 3% whle the 10-year yield trades down to 4.45%. Gold prices are rallying as investors take more of a risk-off approach, and Bitcoin is down another 3% to less than $64K.
Asian stocks were lower across the board overnight, following the lead of US equities on Wednesday and the follow-through into the overnight session. The Nikkei was down 1.4%, while South Korea fell 1.8%. European stocks have much less exposure to Technology and are therefore experiencing a mixed picture rather than trading broadly lower. The STOXX is down 0.2% with the UK leading the way lower (-0.7%). On the upside, France is up 0.8% while Spain and Germany are both up over 0.5%.
In the US today, along with jobless claims at 8:30, we also got Non-Farm Productivity and Unit Labor Costs. Initial claims were higher than expected, while Non Farm Productivity and Unit Labor costs both came in light. Later today, we’ll also hear from a few Fed speakers.
The news of Alphabet’s (GOOGL) equity offering earlier this week reinforced the idea that AI investment will remain strong for quarters to come, but equity prices have rallied sharply and reflected much of that, so all it takes is one company to at least temporarily wreck the party. Yesterday, the party pooper was Broadcom (AVGO). While the company reported better than expected EPS, inline revenues, and raised guidance, the magnitude of the beats and the guidance raise wasn’t enough given the run in the stock over the last year.
As a result, the stock is trading down 15% in the pre-market, shaving more than $300 billion off its market cap and dragging the rest of the Technology sector down with it. The S&P 500 Technology sector is on pace to gap down over 2% at the open, while Nasdaq 100 futures are down 1.4%. If you own a tech stock that was up a lot over the last few days, you’re looking at some relatively steep losses this morning.
If current levels hold until the open, today will be the Nasdaq 100 ETF’s (QQQ) 9th downside gap of at least 1% this year and the 533rd since its inception in 1999. In other words, these types of declines are relatively common.
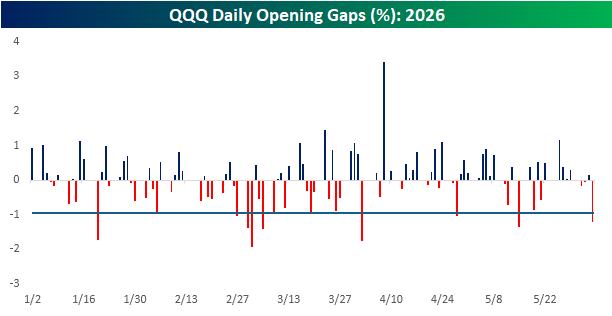
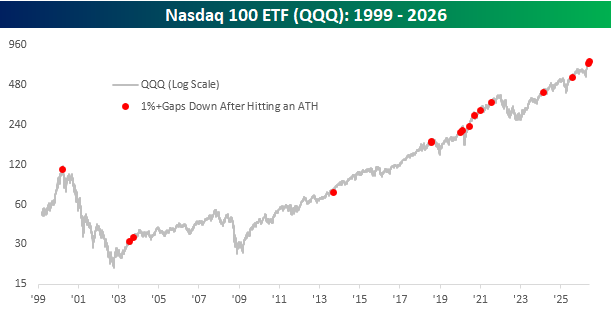
What makes this morning’s decline somewhat more unique is that it comes after QQQ traded at an all-time high on an intraday yesterday. Since the ETF’s inception in 1999, there have only been fifteen other occurrences when it gapped down 1%+ the day after hitting an all-time high. Ironically, though, this is the second occurrence in less than a month. Less than three weeks ago, QQQ gapped down 1.34% the day after hitting an all-time high the day before.
The chart below shows each of those occurrences going back to 1999. The first occurrence was in March 2000, coinciding with QQQ’s peak from the dot-com bubble. From there, QQQ fell more than 50% over the next year and ultimately declined more than 80%. First impressions tend to linger, so investors around at the time have nightmares about that type of setup. Besides the March 2000 occurrence, most of the other times that we saw QQQ gap down 1%+ after hitting an all-time high occurred in the middle of longer-term bull markets rather than at the end.
Start a two-week trial to Bespoke Premium to continue reading today’s full Morning Lineup.
The Closer – Crude & Products, PMIs, Beige Book – 6/3/26
Log-in here if you’re a member with access to the Closer.
- Strategic petroleum reserves continue to experience a record drawdown as distillate inventories approach multi-decade lows.
- Even after an updated methodology was introduced in 2022, the explanatory power of the ADP payrolls estimate for the official BLS data is very low.
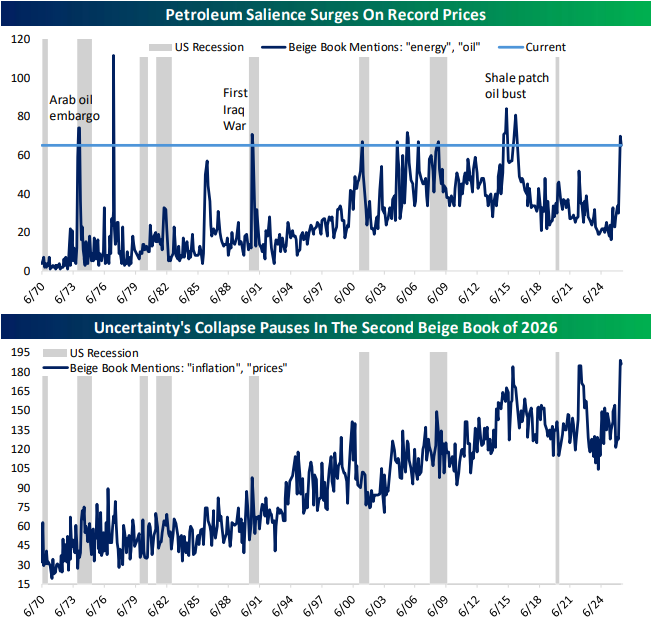
- The latest release of the Beige Book showed slightly weaker evaluations of the economy relative to the prior release as inflation and energy mentions were commonplace.
See today’s full post-market Closer and everything else Bespoke publishes by starting a 14-day trial to Bespoke Institutional today!
A Record Streak Comes to an End
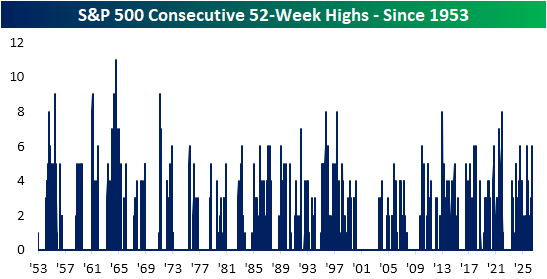
As the S&P 500 is turning decisively lower today, currently down 0.6% as of this writing, the index is on pace to end a nine-day winning streak. Not only that, but since coming back from the Memorial Day holiday, the S&P 500 has closed at a record high each session up until today. As shown below, this marks the 34th time since the inception of the current five-day trading week that the index has logged a streak of six or more consecutive 52-week highs. The most recent other examples were also exactly six days long, ending in July of 2024 and 2025.
One topic we have frequently covered over the last couple of months has been the S&P 500’s continued surge to record highs despite signs of weak participation. While the index’s cumulative A/D line has been basically rangebound all year, a clear divergence has emerged since mid-April: price has continuously made new highs, but the A/D line has been trending lower.
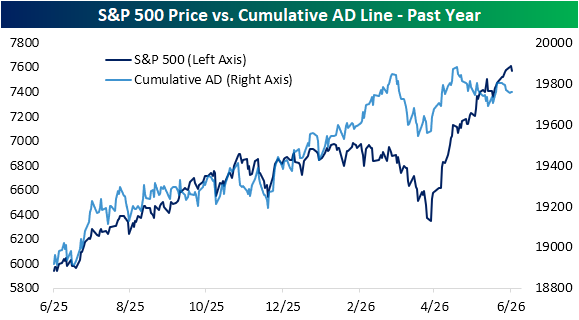
Again, looking to the past several days, price action has resulted in a historic streak that we have been keeping tabs on in our Daily Sector Snapshot. Not only has the S&P 500 reached 52-week highs each day through yesterday’s close, but it did so with the daily advance/decline number being negative for most. Of that string of record highs, yesterday was the first one on positive breadth. In other words, last Tuesday through this past Monday, all saw a positive daily change in the S&P 500 on negative breadth. There have only been two other times since 1990 when the daily change in price and breadth moved in opposite directions for five sessions in a row—the first in April 1999 and the other in June 2024—and further, there has never been such a long streak when each of those days resulted in 52-week highs.
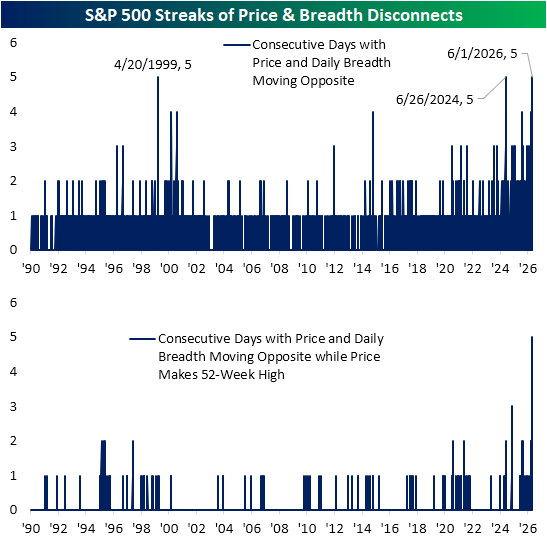
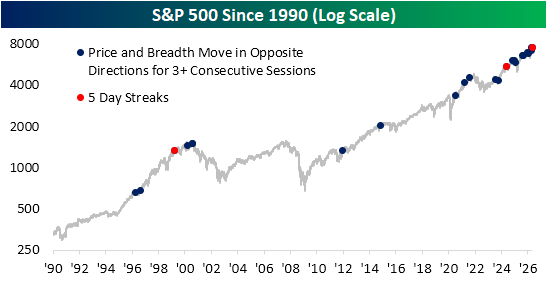
In the chart below, we highlight those streaks of consecutive days in which price and breadth moved in opposite directions for at least three sessions in a row, and also highlight those streaks, like the most recent that went on to five days. As shown, those instances have become increasingly common in recent years as the S&P 500 has grown increasingly concentrated, as we discussed in today’s Chart of the Day.
With the July 4th holiday coming up, make sure to pick up one (or two or three) of our fun t-shirts or sweatshirts to wear for the 250th. You can find them at Bespoke Threads or an even wider selection at our Task Force 250 store.
Want more from Bespoke? You can start by joining our Think BIG mailing list where you’ll receive an interesting market stat in your inbox a few times per week. All we need is your email address. Join now by clicking here or on the image below.
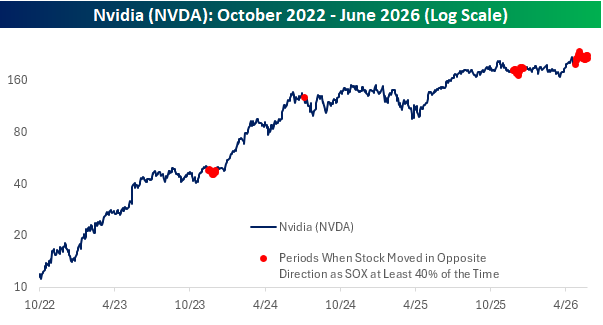
Who are you, and what did you do with Nvidia (NVDA)?
“Who are you, and what did you do with Nvidia (NVDA)?”
Nvidia (NVDA) is the largest company in the world, which also makes it the largest semiconductor company. Therefore, you would think that what’s good for the stock is good for the Philadelphia Semiconductor Index (SOX) and vice versa. Most of the time, that’s the case, but over the last month, we’ve seen the opposite play out, prompting the question above.
Over the last 21 trading days, the daily moves of NVDA and the SOX have been in opposite directions ten times (48%). Just last week, the divergence was even wider, with the two moving conversely on 12 of 21 trading days (57%).
Since this bull market started in October 2022, the two have never moved in opposite directions more frequently than they have in recent weeks. The only other periods where daily divergences occurred with nearly as much frequency were in December 2023, July 2024, and December 2025.
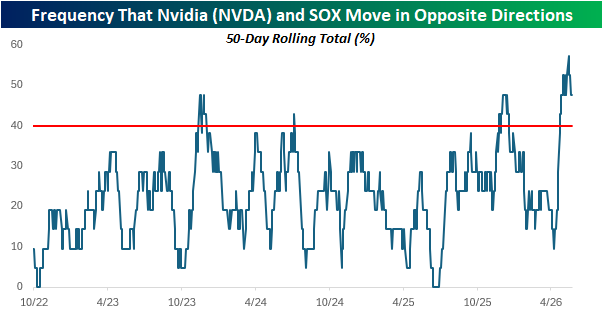
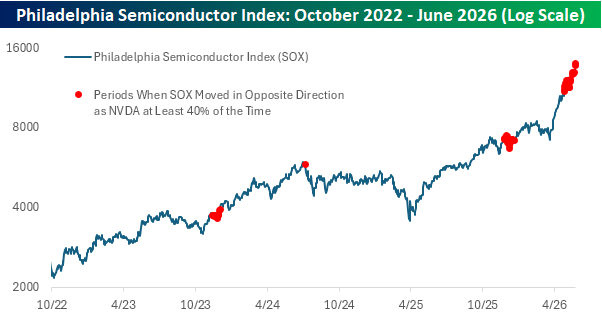
We were curious to see if prior periods of such high-frequency divergence signaled a trend moving forward. In the charts below, we show the performance of NVDA and the SOX since the start of the bull market, with red dots highlighting every time the 21-day frequency of daily divergences exceeded 40%.
For both NVDA and the SOX, forward returns following these periods were all over the map, featuring gains, losses, and sideways trading alike. Therefore, as tempting as it may be to read the recent divergence as a canary in the coal mine for NVDA or the semiconductor space, it’s probably nothing more than a short-term quirk.
With the July 4th holiday coming up, make sure to pick up one (or two or three) of our fun t-shirts or sweatshirts to wear for the 250th. You can find them at Bespoke Threads or an even wider selection at our Task Force 250 store.