Bespoke’s Morning Lineup – 4/13/23 – PPI and Claims
See what’s driving market performance around the world in today’s Morning Lineup. Bespoke’s Morning Lineup is the best way to start your trading day. Read it now by starting a two-week trial to Bespoke Premium. CLICK HERE to learn more and start your trial.
“People who exit the stock market to avoid a decline are odds-on favorites to miss the next rally.” – Peter Lynch

Below is a snippet of content from today’s Morning Lineup for Bespoke Premium members. Start a two-week trial to Bespoke Premium now to access the full report.
Yesterday’s weaker-than-expected headline CPI for March didn’t ultimately do much to boost the market, and today the focus will shift to the PPI which is expected to come in unchanged m/m at the headline level and increase 0.2% on a core basis. Along with PPI, jobless claims will also be released, and those are expected to increase to 235K from 228K last week. After weeks of thinking that initial claims were stuck below 200K, we learned last week that after benchmark revisions claims have actually been above 200K for nine straight weeks and 18 of the last 20. Amazing how some revisions can have such an impactful change on the narrative.
We don’t know what to call what the market has done over the last six months, but yesterday did mark the six-month anniversary of the October low. The S&P 500 is up 12.6%, and its peak performance was a gain of 14.4% as of February 2nd before the stronger-than-expected January employment report sparked a sell-off of nearly 8%. During that decline, the S&P 500 managed to stay above its prior low from December, and in the rally that followed it has yet to even test its February high. That’s just another reason we don’t know what to call what the market has done over the last six months. New bull market? Bear market rally? We are in a bit of a no man’s land.
The chart below shows the performance of the S&P 500 and its industry groups since the 10/12 closing low (blue bars) and each one’s peak performance from the close on 10/12 (gray bars). Semis have been leading the way higher, and it’s not even close. Through yesterday’s close, the group was up over 50%, and at its post-October peak, it was up just shy of 60%. Behind Semis, the only other groups in ‘bull market territory’ (up 20%+) are Consumer Durables, Consumer Services, Software, and Capital Goods.
With only five groups up 20%, it’s not the type of performance you would expect to see if this was a bull market, but at the same time, there has been nothing normal about anything market or economic-related in the last three years. While only five groups are currently up 20%, 14 of the 24 have been up at least 20% relative to their 10/12 close at some point since then. The fact that Semis have led the advance is probably one of the most encouraging characteristics of the market’s performance over the last six months. The group is one of the most cyclical of them all and the best leading indicator for the broader market.

Our Morning Lineup keeps readers on top of earnings data, economic news, global headlines, and market internals. We’re biased (of course!), but we think it’s the best and most helpful pre-market report in existence!
Start a two-week trial to Bespoke Premium to read today’s full Morning Lineup.
The Triple Play Report — 4/12/23
An earnings triple play is a stock that reports earnings and manages to 1) beat analyst EPS estimates, 2) beat analyst sales estimates, and 3) raise forward guidance. You can read more about “triple plays” at Investopedia.com where they’ve given Bespoke credit for popularizing the term. We like triple plays as an indication that a company’s business is firing on all cylinders, with above-expectations results and an improving outlook. A triple play is indicative of positive “fundamental momentum” instead of pure fundamentals, and there are always plenty of names with both high and low valuations on our quarterly list.
Bespoke’s Triple Play Report highlights companies that have recently reported earnings triple plays, and it features commentary from management on triple-play conference calls, company descriptions and analysis, and price charts. Bespoke’s Triple Play Report is available at the Bespoke Institutional level only. You can sign up for Bespoke Institutional now and receive a 14-day trial to read this week’s Triple Play Report, which features seven stocks. To sign up, choose either the monthly or annual checkout link below:
Bespoke Institutional – Monthly Payment Plan
Bespoke Institutional – Annual Payment Plan

Chart of the Day: Earnings Seasonality and Triple Play Streaks
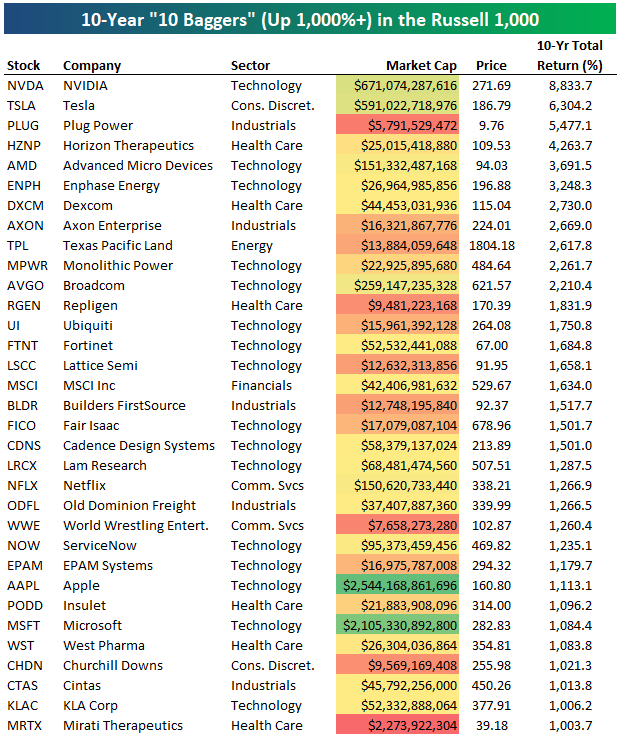
10-Year 10-Baggers
Peter Lynch’s 1989 book One Up On Wall Street introduced investors to the word “ten bagger,” which represents an investment that appreciates by 10x (1,000%) its initial purchase price.
Today we wanted to highlight the stocks that have been “ten baggers” over the last ten years. In the Russell 1,000, 33 names are up more than 1,000% since April 12th, 2013. Over the same 10-year period, the S&P 500 tracking ETF (SPY) is up 211%. As shown below, NVIDIA (NVDA) is up the most with a gain of 8,833%, followed by Tesla (TSLA) at 6,304% and then Plug Power (PLUG) at 5,477%.
There are 16 Technology stocks on the list of 33 ten baggers, which is the most of any sector. Other Tech stocks on the list include AMD, Enphase Energy (ENPH), Broadcom (AVGO), Fortinet (FTNT), Lam Research (LRCX), and even the two largest stocks in the US – Apple (AAPL), and Microsoft (MSFT). Netflix (NFLX) is also another notable on the list with a gain of 1,266%.
Some other notables include Industrials stocks like Axon — the maker of Tasers and police body cameras, Industrials stocks like Builders FirstSource (BLDR) and Old Dominion Freight (ODFL), and Vince VcMahon’s World Wrestling Entertainment (WWE), which is set to be bought by Endeavor Group (EDR).
Stocks that are already up 1,000%+ over the last ten years seem unlikely to repeat that over the next ten years. The obvious next question is: which stocks will be ten baggers over the next ten years? As Peter Lynch instructed, you’ll have to do your research!
Have you tried Bespoke All Access yet?
Bespoke’s All Access research package is quick-hitting, actionable, and easily digestible. Bespoke’s unique data points and analysis help investors better visualize underlying market trends to ultimately make more informed investment decisions.
Our daily research consists of a pre-market note, a post-market note, and our Chart of the Day. These three daily reports are supplemented with additional research pieces covering ETFs and asset allocation trends, global macro analysis, earnings and conference call analysis, market breadth and internals, economic indicator databases, growth and dividend income stock baskets, and unique interactive trading tools.
Click here to sign up for a one-month trial to Bespoke All Access, or you can read even more about Bespoke All Access here.

Bespoke’s Morning Lineup – 4/12/23 – Here it Comes and There it Goes
See what’s driving market performance around the world in today’s Morning Lineup. Bespoke’s Morning Lineup is the best way to start your trading day. Read it now by starting a two-week trial to Bespoke Premium. CLICK HERE to learn more and start your trial.
“Simple can be harder than complex: You have to work hard to get your thinking clean to make it simple.” – Steve Jobs
Below is a snippet of content from today’s Morning Lineup for Bespoke Premium members. Start a two-week trial to Bespoke Premium now to access the full report.
Investors took an optimistic tone heading into the release of March CPI with futures marginally higher. Headline CPI came in at 0.1% m/m which was less than the 0.2% forecast. Core CPI increased by 0.4% which was right in line with forecasts. On a y/y basis, headline CPI was 5.0% versus estimates of 5.1% while core increased by 5.6% which was right in line with consensus forecasts. The immediate response in the futures market was higher equities and much lower yields as the 2-year drops back below 4%.
CPI reports have become increasingly important in the eyes of market commentators in the post-COVID environment. From an outsider’s perspective, you would think that these are the most important days of the month. Looking at the actual data, though, CPI reports may not necessarily be as impactful as you would originally think.
The chart below compares the S&P 500’s median daily percentage change on all market days versus CPI days for three different periods. First, for all days since 2000, the S&P 500’s median daily change is the same for all days versus CPI days (0.55%), so we can consider that the baseline. Since the start of 2020, when COVID first started showing up in the headlines, the S&P 500’s median daily percentage move on all days has been 0.74% versus 0.59% on CPI days. In other words, in the post-COVID world, the S&P 500 has been less volatile on CPI days versus all market days.
Where the stock market has become more volatile on CPI days is since November 2021 when Fed Chair Powell retired the term transitory. From then until now, the S&P 500’s median daily change has increased to 0.88% while on CPI days, it has risen to 0.95%. So, yes CPI reports have taken on an added significance, but they may not be as impactful as you would think from the headlines. CPI day or not, in the post-COVID world and even more so in the post ‘transitory’ world as the Fed aggressively hiked rates, the market has become more volatile on all trading days. This morning, the CPI report is the most important release of the year so far, but by this afternoon, it will have faded well into the rearview mirror.

Our Morning Lineup keeps readers on top of earnings data, economic news, global headlines, and market internals. We’re biased (of course!), but we think it’s the best and most helpful pre-market report in existence!
Start a two-week trial to Bespoke Premium to read today’s full Morning Lineup.
Industry Performance and CPI
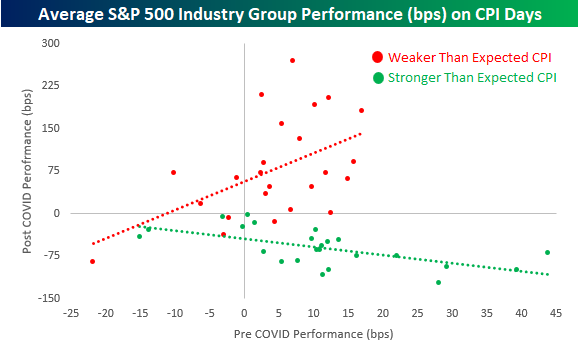
Tomorrow’s release of March CPI is expected to show headline inflation cooling to 5.1% on a y/y basis from 6.0% in February. In the table below, we break down the average performance (in basis points) of each of the 24 industry groups in the S&P 500 on days of CPI releases since 2000 based on how the headline reading came in relative to expectations. There have been some notable shifts in reactions among groups to CPI reports in the pre and post-COVID (February 2020) periods. For example, in the pre-COVID period, the three best-performing industry groups on days when CPI was stronger than expected were Real Estate, Banks, and Semis. In the post-COVID period, though, these three industry groups have been among the market’s worst performers on CPI beats with all three averaging one-day declines of at least 69 bps compared to the S&P 500’s average decline of 62 bps. Interestingly, the disparity is a lot less apparent when we compare pre and post-COVID performance on days when CPI is weaker than expected.

To further illustrate this shift and how it has been much more notable on days when the CPI is stronger than expected, the scatter chart below compares industry group performance on CPI days in the pre and post-COVID periods when the headline reading comes in better and worse than expected. Starting with weaker-than-expected CPI days (red dots and red trendline), the trendline is positively sloped as groups that tended to perform best on weaker-than-expected CPI days are generally still performing the best while the industry groups that lagged on weaker-than-expected CPI days still tend to lag in the post-COVID period. The performance dynamic on stronger-than-expected CPI days (green dots and trendline), however, is the complete opposite as the trendline is negatively sloped indicating that the best-performing groups pre-COVID have tended to be the weakest in the post-COVID period and vice versa.
Have you tried Bespoke All Access yet?
Bespoke’s All Access research package is quick-hitting, actionable, and easily digestible. Bespoke’s unique data points and analysis help investors better visualize underlying market trends to ultimately make more informed investment decisions.
Our daily research consists of a pre-market note, a post-market note, and our Chart of the Day. These three daily reports are supplemented with additional research pieces covering ETFs and asset allocation trends, global macro analysis, earnings and conference call analysis, market breadth and internals, economic indicator databases, growth and dividend income stock baskets, and unique interactive trading tools.
Click here to sign up for a one-month trial to Bespoke All Access, or you can read even more about Bespoke All Access here.
Chart of the Day – Analysts Have Been Increasingly Pessimistic On These Three Sectors
Inflation Concerns Continue to Ease
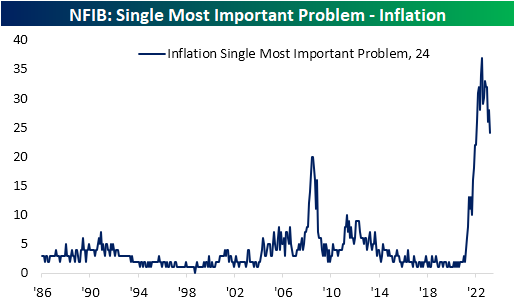
In an earlier post, we mentioned the record-low reading in the percentage of small businesses perceiving now as a good time to expand. As for what these firms perceive to be their most pressing issues, inflation continues to be the single most prevalent answer at 24%, albeit the gap has narrowed dramatically. Quality of labor is now only a single percentage point behind inflation at 23%, and when combined with cost of labor, the two issues account for over a third of small businesses’ biggest problems. From a historical standpoint, inflation, quality of labor, and cost of labor all remain elevated and account for a massive share (58%) of the most pressing issues facing small businesses.

The four percentage point drop month over month in the percentage of respondents reporting inflation as their biggest issue is the largest decline since January when it fell six percentage points. As a result, the category is only down to the lowest level since January 2022 which remains well outside the range of pre-pandemic readings. In other words, inflation has improved compared to last July when it was top of mind for 37% of small businesses, but it is still nowhere near a non-issue.
Picking up some of those losses has been government-related concerns. This series has historically held a political bias in which under Republican administrations, small businesses are less concerned with red tape and taxes and vice versa during Democratic administrations. With the surge in inflation concerns during President Biden’s tenure, this index has remained historically low but has begun to rise more recently as inflation has improved.

Another area to see a rise in firms reporting it as their biggest problem has been poor sales. While the reading is far from flying, it has begun trending higher now accounting for 5% of responses in March. That pairs with the index for actual reported sales changes which have remained firmly negative for nearly a year now. When poor sales turn into the biggest problem for a small business, you know times are really tough, which is why we’ll be watching this reading closely in the months ahead. For now, the reading is still extremely low, which is a good thing.

Have you tried Bespoke All Access yet?
Bespoke’s All Access research package is quick-hitting, actionable, and easily digestible. Bespoke’s unique data points and analysis help investors better visualize underlying market trends to ultimately make more informed investment decisions.
Our daily research consists of a pre-market note, a post-market note, and our Chart of the Day. These three daily reports are supplemented with additional research pieces covering ETFs and asset allocation trends, global macro analysis, earnings and conference call analysis, market breadth and internals, economic indicator databases, growth and dividend income stock baskets, and unique interactive trading tools.
Click here to sign up for a one-month trial to Bespoke All Access, or you can read even more about Bespoke All Access here.
Small Business Outlook Cratering
Small business optimism continued to decline in March with the headline index from the NFIB falling from 90.9 down to 90.1. That headline reading was actually better than the consensus forecast of 89.3, but it was still in the bottom decile of the indicator’s historical range dating back to 1986.

Looking across individual categories, breadth was weak in the report with only three indices moving higher month over month, three going unchanged, and all the others falling. As with the headline number, many categories are historically depressed in the bottom decile of readings, including some record lows.
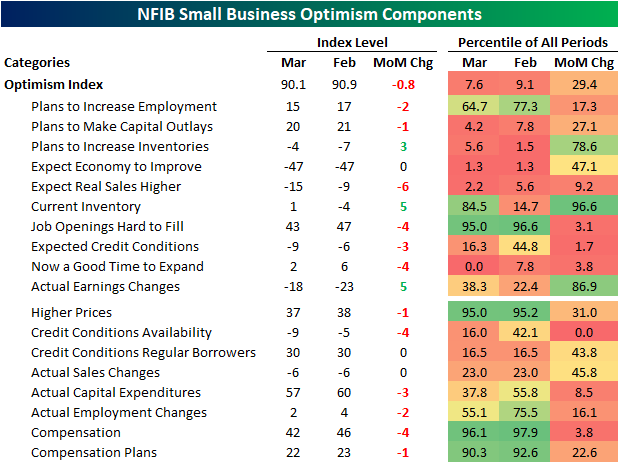
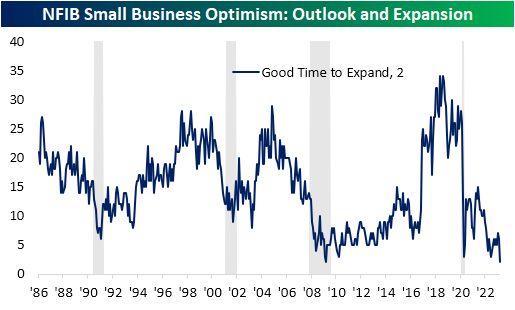
That record low was in the percentage of respondents reporting now as a good time to expand. Only 2% reported now as a good time to expand, down 4 points month over month. While the reading has been at the low end of its historical range for much of the past year, March’s reading matched the historical low from March 2009.
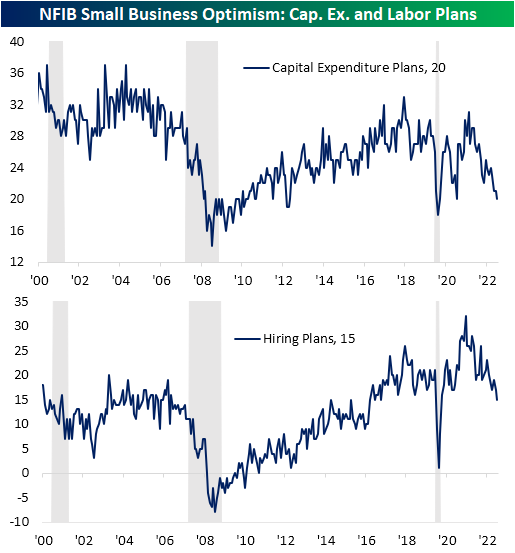
Given the small business outlook for the economy has soured, fewer firms are reporting plans to increase hiring or capital expenditures. In fact, the index for capex plans fell to 20, which alongside March 2021, is the lowest reading since the spring of 2020. Similarly, hiring plans are at new lows for the post-pandemic period.
One factor likely impacting business plans has been financial conditions. The most pronounced decline of any category last month was a record 4-point decline in the availability of loans. While the reading has been rolling over for some time, that drop leaves the index at the lowest level since December 2012.

Have you tried Bespoke All Access yet?
Bespoke’s All Access research package is quick-hitting, actionable, and easily digestible. Bespoke’s unique data points and analysis help investors better visualize underlying market trends to ultimately make more informed investment decisions.
Our daily research consists of a pre-market note, a post-market note, and our Chart of the Day. These three daily reports are supplemented with additional research pieces covering ETFs and asset allocation trends, global macro analysis, earnings and conference call analysis, market breadth and internals, economic indicator databases, growth and dividend income stock baskets, and unique interactive trading tools.
Click here to sign up for a one-month trial to Bespoke All Access, or you can read even more about Bespoke All Access here.
Bespoke’s Morning Lineup – 4/11/23 – Small Businesses Glum
See what’s driving market performance around the world in today’s Morning Lineup. Bespoke’s Morning Lineup is the best way to start your trading day. Read it now by starting a two-week trial to Bespoke Premium. CLICK HERE to learn more and start your trial.
“What are the odds that people will make smart decisions about money if they don’t need to make smart decisions—if they can get rich making dumb decisions?” – Michael Lewis
Below is a snippet of content from today’s Morning Lineup for Bespoke Premium members. Start a two-week trial to Bespoke Premium now to access the full report.
It’s looking like another quiet start to the trading day here in the US as equity futures are little changed and the yields on two and ten-year US Treasuries have moved less than a basis point. The only economic report on the calendar today was the NFIB’s index of small business sentiment, and while it was slightly better than expected, the headline index declined and remains below where it was at the depths of the COVID shutdowns. Within that report, the percentage of small businesses saying now is a good time to expand dropped to levels only seen at the depths of the Financial Crisis in March 2009 while the index for hiring plans dropped to its lowest level since May 2020. In other words, small business sentiment is not particularly optimistic. We’d also note that within the latest Commitment of Traders report, net short positions on the S&P 500 reached their highest level since 2007, so it’s not as though investors are positioned bullishly against the weaker macro backdrop.
In Europe, Retail Sales for February fell 0.8% on a m/m basis, but that was actually in line with expectations. Stocks on the continent are modestly higher after yesterday’s holiday
As recession concerns have grown in the wake of the SVB Financial and Signature Bank failures and the run of deposits from other smaller banks, investors have become increasingly convinced that the indicators which have been flashing recession warning signs for months now may in fact turn out to be accurate. If the economy was slipping into recession, one would expect to see those concerns manifesting in the performance of cyclical sectors. Specifically, Industrials would be one sector expected to underperform while defensive sectors like Utilities would outperform. Looking at the relative strength of the two sectors, however, the market’s message hasn’t exactly confirmed the headlines.
The chart below shows the ratio in closing prices between the S&P 500 Industrials sector ETF (XLI) versus the Utilities sector (XLU). When the line is rising, the Industrials sector is outperforming Utilities and vice versa. Over the last five years, there have been two distinct troughs in the chart. The first was in March 2020 while the next was last September. Back in late February, it looked as though the ratio was on the verge of hitting new five-year highs, but the bank failures and run on deposits stopped the relative outperformance of Industrials right in its tracks. It’s still too early to tell whether this will be a temporary pause or a new leg lower in the ratio, but with banks kicking off earnings season later this week, the tone of companies giving their results will shed a lot of light on that answer. At this point, if the market really was convinced of an impending recession, this ratio would likely be falling much faster.

Our Morning Lineup keeps readers on top of earnings data, economic news, global headlines, and market internals. We’re biased (of course!), but we think it’s the best and most helpful pre-market report in existence!
Start a two-week trial to Bespoke Premium to read today’s full Morning Lineup.