Q4 2025 Earnings Conference Call Recaps: Tesla (TSLA)
Bespoke’s Conference Call Recaps use AI to summarize lengthy earnings calls. The commentary below is AI-generated and then edited by Bespoke for quality control. As always, none of these summaries should be construed as recommendations to buy or sell any securities, and investors should do their own research and/or consult with a financial professional before making any investment decisions.
Our latest recap available to Bespoke subscribers covers Tesla’s (TSLA) Q4 2025 earnings call.
![]()
Tesla (TSLA) designs and manufactures electric vehicles, battery energy storage systems, and humanoid robots. Beyond its mass-market Model 3 and Y, the company is distinguished by its “Physics First” engineering and in-house semiconductor design. Tesla serves a global market of tech-forward consumers and utility-scale energy providers, offering insight into the convergence of autonomous mobility and domestic manufacturing. It is currently the only major US automaker operating its own lithium and cathode refineries. Tesla is undergoing a historic pivot, prioritizing an autonomous future over traditional hardware. Management announced the “honorable discharge” of the legacy Model S and X lines, as CEO Elon Musk put it, to convert Fremont factory space for Optimus robot production, targeting 1 million units annually. Despite 2025 delivering Tesla’s first annual revenue decline (falling 3% to $94.8B), the stock rose initially on news of a massive $20B+ CapEx plan for 2026, more than double previous guidance. This capital will fund six new factories and a domestic TerraFab to mitigate geopolitical chip risks. Tesla also confirmed a $2B investment in xAI to integrate Grok for fleet management. While the energy business hit record profits ($12.8B revenue), the focus is now squarely on the April Cybercab production launch and the transition to a subscription-only FSD model. Despite a higher open on 1/29 after posting better-than-expected results, shares fell intraday and closed near session lows, down 3.5% on the day…
Continue reading our Conference Call Recap for TSLA by becoming a Bespoke Institutional subscriber. You can sign up for Bespoke Institutional now and receive a 14-day trial to read our newest Conference Call Recap. To sign up, choose either the monthly or annual checkout link below:
Bespoke’s Morning Lineup – 2/2/26 – At Least It’s the Shortest Month
See what’s driving market performance around the world in today’s Morning Lineup. Bespoke’s Morning Lineup is the best way to start your trading day. Read it now by starting a two-week trial to Bespoke Premium. CLICK HERE to learn more and start your trial.
“Shut your eyes and see.” – James Joyce

Below is a snippet of commentary from today’s Morning Lineup. Start a two-week trial to Bespoke Premium to view the full report.
After a shaky end to the week and the month for US markets on Friday, things remain somewhat unsteady as we kick off the new month. S&P 500 futures indicate a 0.3% decline at the open, while the Nasdaq is priced to open down twice as much. For both indices, current levels are well off their lows so that it could have been a lot worse.
Treasury yields are slightly lower, with the 10-year yield starting the week at 4.23%. Crude oil is sharply lower, trading down close to 5% as President Trump suggested that the Iranians are looking to come to the bargaining table. In the metals space, it’s a mixed picture with gold up about 1% while silver bounces over 6%. Copper and Platinum, meanwhile, are both lower. After moves like we saw late last week in the space, though, we would expect more wild trading in the days ahead. These types of volatility spikes have a way of lasting more than a few days before things finally settle down.
It was a negative start to the week in Asia as the Nikkei fell over 1%, while Hong Kong and China both slumped by more than 2%. The big loser, though, was South Korea, where the KOSPI plunged over 5%, and trading briefly came to a halt because of circuit breakers. The weakness in that index stemmed from a weekend story in the WSJ where Nvidia CEO Jensen Huang said that the company’s investment in OpenAI will not be the $100 billion previously reported, and that has raised new concerns about the vitality of the AI trade.
Today is one of those rare days, it seems, where the lack of a vibrant technology sector in Europe is a plus. The STOXX 600 is up 0.4%, and the German DAX and Spain’s IBEX 35 each rally over 0.75%. Better-than-expected manufacturing PMIs for January have also acted as a positive catalyst.
In the US today, the only economic report on the calendar is the ISM Manufacturin,g which is projected to rebound slightly from December’s reading of 47.9. Given the surprise strength in the Chicago PMI last week, though, don’t be surprised if that report comes in hot. Outside of economic data, the first major tech report of the week will be Palantir (PLTR) after the close. As we detailed in today’s Chart of the Day, growth-oriented sectors of the market have been messy lately, so PLTR’s report could have big implications for the sector.
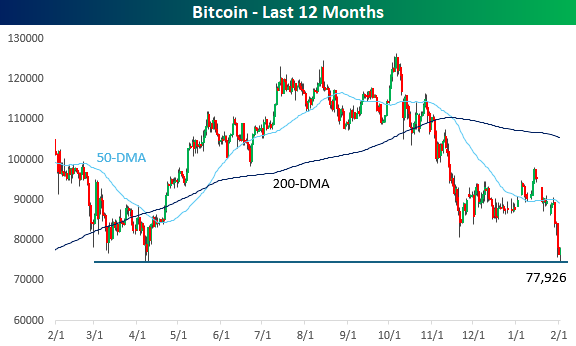
Along with growth-oriented stocks, crypto assets have been terrible performers for the last few months, and over the weekend, Bitcoin tested 52-week lows near $75K. Prices are rebounding slightly this morning along with equity futures, but the burden of proof is firmly on the back of the bulls now as Bitcoin’s price trades near the breakeven price for all of Strategy’s (MSTR) holdings.
While it’s been a painful few months for crypto, it’s worth pointing out that this remains just a run-of-the-mill decline for Bitcoin. While it’s currently down about 39% from its all-time high, on any given day since 2016, its average drawdown from an all-time high has been over 35%.
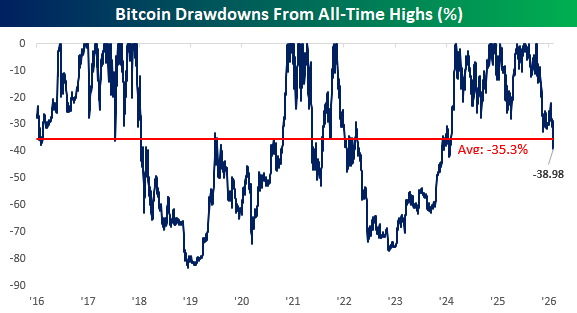
Chart of the Day – Messy Market
Brunch Reads – 2/1/26
Welcome to Bespoke Brunch Reads — a linkfest of some of our favorite articles over the past week. The links are mostly market-related, but there are some other interesting subjects covered as well. We hope you enjoy the food for thought as a supplement to the research we provide you during the week.
Dedicated to Definitions: On February 1, 1884, the Oxford English Dictionary debuted. Although not as a finished book, it was the first published installment of what would become the most ambitious language project ever attempted. The opening collection, covering words just from A to Ant, was released in London after decades of preparation. It was the start of a project seeking to document every English word, its meanings, and its history.
The project began in the 1850s. Under editor James Murray, thousands of volunteers, including teachers, clerks, scholars, and even inmates, submitted millions of handwritten quotation slips showing how words were actually used across centuries. Murray famously worked from a backyard “scriptorium,” surrounded by pigeonholes stuffed with these citations. What readers got in 1884 was only a glimpse of the scale to come. The full dictionary wouldn’t be completed until 1928, more than 40 years later, spanning 10 volumes.

AI & Technology
AI Productivity’s $4 Trillion Question: Hype, Hope, And Hard Data (Forbes)
While individual tasks like coding and customer service show efficiency spikes as high as 55%, AI has yet to move the needle on national economic growth. This disconnect stems from a staggering 95% failure rate in corporate pilots and a skill-leveling effect where the technology primarily boosts underperformers while occasionally slowing down experts. [Link]
Continue reading our weekly Brunch Reads linkfest by logging in if you’re already a member or signing up for a trial to one of our two membership levels shown below! You can cancel at any time.

The Bespoke Report – 1/30/26 – That’s a Wrap
To read our weekly Bespoke Report newsletter and access everything else Bespoke’s research platform offers, start a two-week trial to Bespoke Premium.
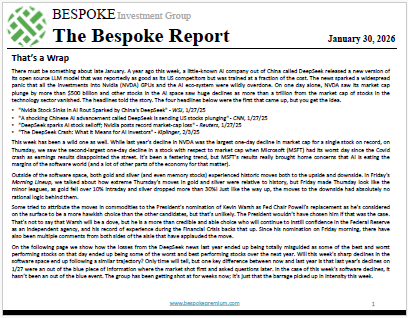
A year after DeepSeek roiled markets, this week, software stocks faced a reckoning as investors questioned their future in an AI world. We cover this and a lot more in this week’s Bespoke Report newsletter. Give the full report a read by starting a trial here.

Bespoke’s Morning Lineup – 1/30/26 – You’re Hired
See what’s driving market performance around the world in today’s Morning Lineup. Bespoke’s Morning Lineup is the best way to start your trading day. Read it now by starting a two-week trial to Bespoke Premium. CLICK HERE to learn more and start your trial.
“Hi-yo, Silver! – The Lone Ranger
Below is a snippet of commentary from today’s Morning Lineup. Start a two-week trial to Bespoke Premium to view the full report.
Warsh it is. After months of speculation in the horse race among potential candidates, President Trump announced his boardroom decision, and the winner of “The Apprentice: Federal Reserve” is Kevin Warsh. Futures initially sold off sharply when news of the nomination first hit the tape last night; they have since recovered much of those losses. The major averages are now looking at more modest declines of 0.50% or less. It remains to be seen how Kevin Warsh will act when he’s in the Chairman’s seat, and while he may be considered as more hawkish than some of the other nominees, he’s well respected by the street. Furthermore, all worries over Fed independence over the last six months can probably be put to rest.
It was a lower session to close the week in Asia, as major country benchmarks ended the week with mixed returns. Japan finished the week down 1% while China was down less than half that. On the upside, the Hang Seng had a much better week, rallying 2.4%, but couldn’t hold a candle to South Korea, which rallied 4.7%. Japanese yields pulled in a bit after Tokyo CPI decelerated from 2.0% to 1.5% y/y.
In Europe, it’s a much more positive tone this morning as the STOXX 600 is up nearly 1% with Spain’s 1.8% rally leading the way, although no major benchmark is up less than 0.5%. Banks are seeing some of the largest gains, but the rally has been broad-based with Energy and Materials being the only sectors in the red, while advancers outpace decliners at a 5-2 rate. In economic data, Eurozone GDP rose more than expected 0.3% while CPI in Spain declined more than expected (-0.4% m/m).
The only economic data on the calendar today in the US is PPI at 8:30 and Chicago PMI at 9:45, but the main area of focus will be the President’s nomination of Kevin Warsh to replace Powell. PPI came in much higher than expected on both a headline (0.7% vs 0.3%) and core level (0.5% vs 0.2%), so that has pushed futures down a bit again.
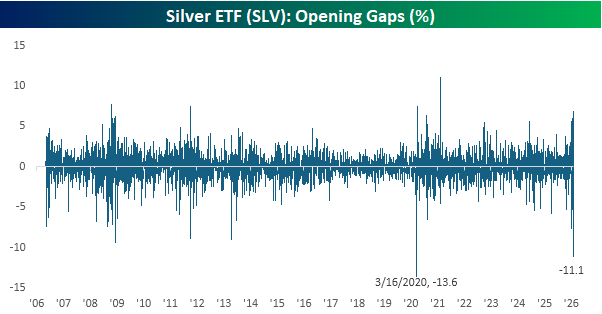
It seems fitting that on the anniversary of the Lone Ranger radio debut in 1933, we’re getting some historic moves in silver over the last 24 hours. Let’s start with the Silver ETF (SLV). In yesterday’s session, the ETF traded as high as $109.83 before cratering to $96.74 and then settling at $105.57. From its intraday high to its intraday low, though, SLV traded in a 13.5% range which was the second largest intraday range in the ETF’s history, trailing only the “marathon” 26.2% intraday range on 10/10/08 during the thick of the financial crisis.
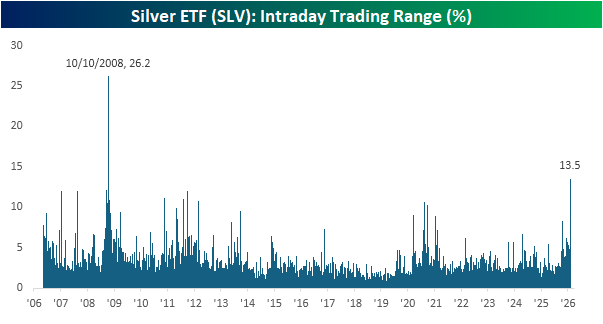
As if yesterday’s session wasn’t enough volatility for you, this morning, the SLV ETF is on pace to gap down 11.1%, which would be just the second time in its history that it opened down more than 10%. The only larger downside gap was a 13.6% decline on 3/16/20 during the heart of the Covid crash. In terms of yesterday’s range and today’s downside gap, recent activity in SLV is right up there with levels of volatility we saw during major market crises. What’s the issue this time around? The really amazing part about today’s downside gap in SLV, though, is that if current levels hold through the end of the day, it will still be up on the week!
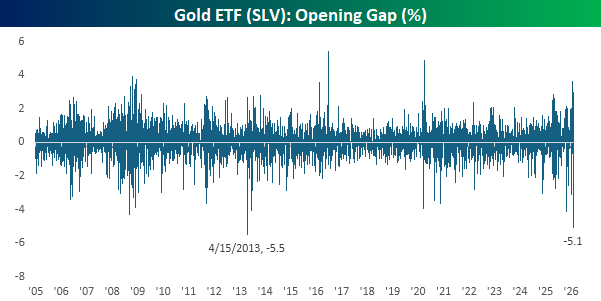
Not to be left out of the volatility party, gold is also poised for a rough start today. The Gold ETF (GLD) is on pace to gap down 5.1%, which would also be the second-largest downside gap in its 20+ year trading history. The only larger downside gap was on Tax Day in 2013, when GLD gapped down 5.5%. Like SLV, though, if current levels hold through the end of the trading day, GLD would also finish the week with a gain!
The Closer – Bad Charts, Software Slide, Earnings – 1/29/26
Log-in here if you’re a member with access to the Closer.
Looking for deeper insight into markets? In tonight’s Closer sent to Bespoke Institutional clients, we lead off with commentary regarding today’s volatility across assets in addition to the damage that has been done to some technical pictures given these moves (pages 1 and 2). Next, we review the odd bear market for software stocks (pages 2 and 3). We follow up with earnings recaps and a quick review of today’s economic data (pages 4 and 5),
See today’s full post-market Closer and everything else Bespoke publishes by starting a 14-day trial to Bespoke Institutional today!
Software Bear Market
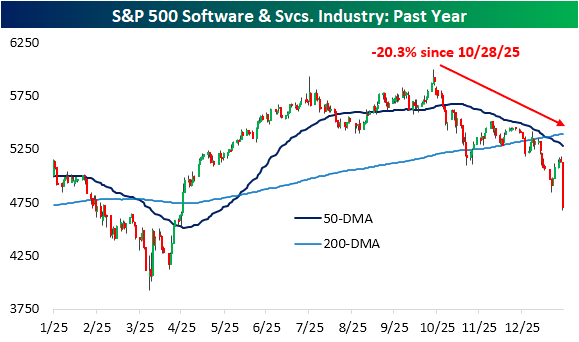
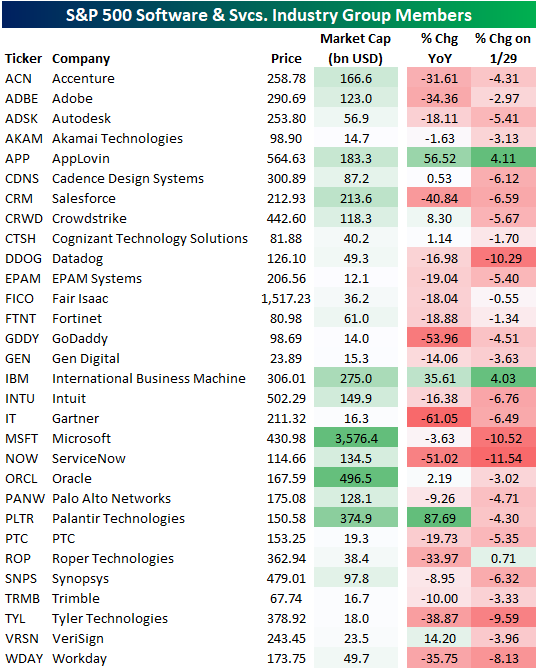
One week ago, we discussed the grim run for software stocks, and flash forward seven days, the picture has only gotten worse. Thursday has been a historically brutal session for the S&P 500’s Software & Services industry as it is currently down 8.5% due in no small part to a 12% decline in the industry’s (and one of the market’s) largest stock: Microsoft (MSFT). Given the steep decline today, the software group is now trading at fresh local lows and has officially surpassed the 20% threshold from the October high to mark a new bear market.
Again, the weakness in MSFT is a key reason for the huge decline given that the S&P 500 is a market-cap weighted index. With that said, though, it is far from the only decliner nor should it receive all of the blame. As shown below, aside from a few names like IBM rallying on the day, most stocks in the group fell 5-10%.
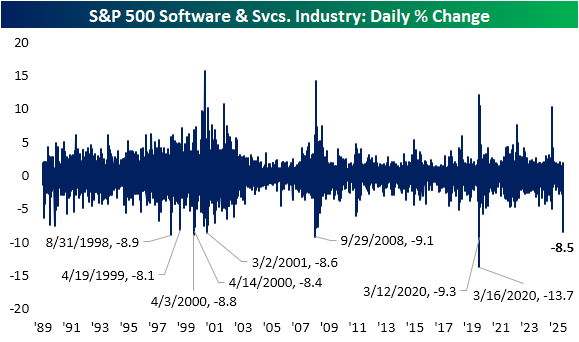
To put today’s drop into historical perspective, below we show the daily change in the industry group for each day going back to the start of our data in September 1989. Today is the single worst decline since the midst of the COVID crash when it fell 9.3% on March 12th and 13.7% on March 16th, 2020. The next big declines as large as today date back to the Financial Crisis and the Dot Com years before that.
Even more notable is today’s decline for software in the context of the broader market. Given Microsoft’s (MSFT) huge weight in addition to other heavy hitters such as Oracle (ORCL), Palantir (PLTR), and Salesforce (CRM) to name a few, this industry alone accounts for about a tenth of total S&P 500 weighting. As a result, this group usually moves in the same direction as the rest of the market, especially in the past couple of decades. Today marks a historic disconnect though. The Software & Services industry is underperforming the broader S&P 500 by almost 8 percentage points. There have only been five other days on record with that degree of underperformance. The most recent of those: March 2001.
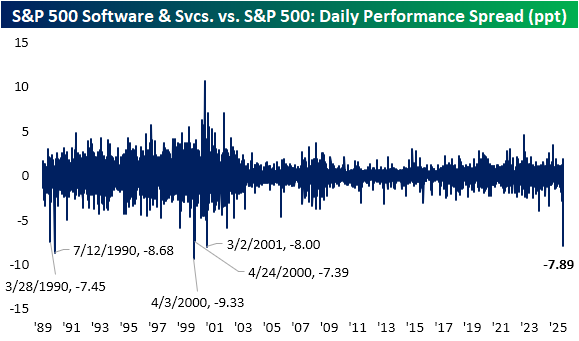

Chart of the Day: ARKVX Enthusiasm
The Bespoke 50 Growth Stocks – 1/29/26
The “Bespoke 50” is a basket of noteworthy growth stocks in the Russell 3,000. To make the list, a stock must have strong earnings growth prospects along with an attractive price chart based on Bespoke’s analysis. There were 9 changes to the list this week.
The Bespoke 50 is available with a Bespoke Premium subscription or a Bespoke Institutional subscription. With Bespoke Premium, you’ll receive a number of daily market updates from us along with our weekly newsletter and a portion of our investor tools. With Bespoke Institutional, you’ll receive everything that’s included with Premium plus additional daily macro analysis and more stock-specific research.
To see all 50 stocks that currently make up the Bespoke 50, simply start a two-week trial to Bespoke Premium or Bespoke Institutional.
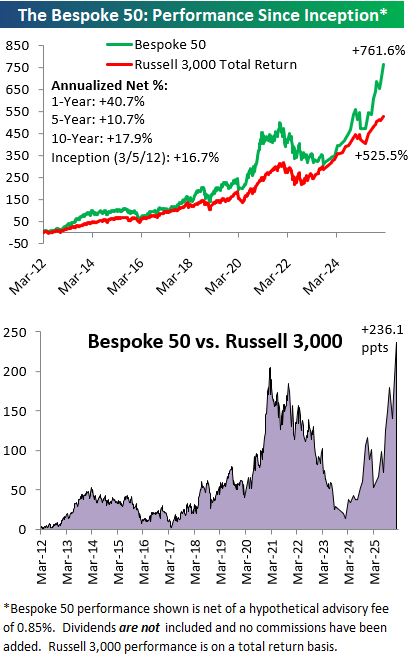
The Bespoke 50 performance chart shown does not represent actual investment results. The Bespoke 50 is updated monthly on Thursdays unless otherwise noted. Performance is based on equally weighting each of the 50 stocks (2% each) and is calculated using each stock’s opening price as of Friday morning after publication. Entry prices and exit prices used for stocks that are added or removed from the Bespoke 50 are based on Friday’s opening price. Any potential commissions, brokerage fees, or dividends are not included in the Bespoke 50 performance calculation, but the performance shown is net of a hypothetical annual advisory fee of 0.85%. Performance tracking for the Bespoke 50 and the Russell 3,000 total return index begins on March 5th, 2012 when the Bespoke 50 was first published. Past performance is not a guarantee of future results. The Bespoke 50 is meant to be an idea generator for investors and not a recommendation to buy or sell any specific securities. It is not personalized advice because it in no way takes into account an investor’s individual needs. As always, investors should conduct their own research when buying or selling individual securities. Click here to read our full disclosure on hypothetical performance tracking. Bespoke representatives or wealth management clients may have positions in securities discussed or mentioned in its published content.