Chart of the Day: Intraday Earnings Weakness
Bespoke’s Morning Lineup – 5/6/24 – Walk the Line
See what’s driving market performance around the world in today’s Morning Lineup. Bespoke’s Morning Lineup is the best way to start your trading day. Read it now by starting a two-week trial to Bespoke Premium. CLICK HERE to learn more and start your trial.
“Success is having to worry about every damn thing in the world, except money.” – Johnny Cash

Below is a snippet of commentary from today’s Morning Lineup. Start a two-week trial to Bespoke Premium to view the full report.
Equities are picking up right where they left off on Friday as futures have been gaining ground all morning. Even the Nasdaq is trading higher despite the disclosure over the weekend that Berkshire Hathaway has cut its stake in Apple (AAPL) by 13%. The stock was down over 1% earlier but has erased most of its pre-market losses. There’s very little in the way of economic data to look forward to this week, but there are still plenty of earnings reports to deal with even though, we’ve passed the peak of the Q1 reporting period.
The S&P 500 eked out its second positive week in a row, and the Nasdaq and Russell 2000 each squeezed out their second week in a row of 1%+ gains. Despite the gains, the S&P 500 still closed the week modestly below its 50-day moving average. If you look at the snapshot of US indices from our Trend Analyzer below, all the major US index ETFs closed out the week clustered right around their 50-day moving averages (DMA). No ETF is more than 0.70% above or below its 50-DMA.

While the indices are all “walking the line” of their 50-DMAs, there’s a little more dispersion at the sector level. Four of eleven sectors are trading at least 1% above or below their 50-DMA. Utilities and Real Estate are the two highest-yielding sectors in the S&P 500, but they have moved in opposite directions this year. As of Friday, Utilities was the most extended relative to its 50-DMA while Real Estate was the furthest below. Besides those two sectors, Health Care and Consumer Staples are the two other sectors trading further than 1% from their 50-DMAs.
Read today’s entire Morning Lineup.

For much more analysis of global equities and economic readings released this morning, read today’s full Morning Lineup with a two-week Bespoke Premium trial.
Brunch Reads – 5/5/24
Welcome to Bespoke Brunch Reads — a linkfest of the favorite things we read over the past week. The links are mostly market-related, but there are some other interesting subjects covered as well. We hope you enjoy the food for thought as a supplement to the research we provide you during the week.
While you’re here, join Bespoke Premium with a 30-day trial!
On This Day in History:

Economic Trends
Eastern Europe Is Richer Than Ever — And More Divided (Bloomberg)
Zakovce, a small village in Eastern Slovakia, exemplifies the dual nature of Eastern Europe’s 20-year membership in the EU. Despite significant infrastructure improvements and economic benefits like a halved unemployment rate due to about €515 billion in EU funding since 2004, there’s growing political unrest. Marian Kuffa, a local priest with conservative views, highlights how income disparities have fueled discontent, gaining influence with his stance on traditional values. This discontent has been amplified by various crises, leading to increased support for nationalist and populist groups. [Link]
California Fast-Food Chains Are Now Serving Sticker Shock (WSJ)
In California, fast-food chains have increased their menu prices following the state’s minimum wage hike for fast-food workers to $20 per hour. Prices in these establishments have risen by 10% since the wage law was negotiated, outpacing increases in other states. The industry argues that these increases are necessary to cover the higher labor costs, though this has prompted some consumers to reconsider their dining habits, opting for more budget-friendly or independent alternatives. [Link]
As it loses customers to rivals, McDonald’s shifts its focus to value (Restaurant Business)
McDonald’s is refining its strategy nationally as it faces customer losses to competitors like Burger King and Domino’s, due to more appealing value options amid inflation pressures. Ian Borden, McDonald’s CFO, emphasized the need for aggressive competitiveness in the market, dubbing it a “street fight” for customer loyalty. Despite this, MCD reported that franchisee profitability has returned to pre-pandemic levels, providing a foundation to bolster value propositions without sacrificing franchisee margins. [Link]
Tesla to lay off everyone working on Superchargers, new vehicles (Ars Technica)
Last week at Tesla was marked by turmoil as CEO Elon Musk recently dismissed key executives responsible for the Supercharger network and new vehicle development. The company’s strategic challenges are underscored by an aging vehicle lineup and a stalled product pipeline, despite its strong Supercharger infrastructure. Amidst ongoing layoffs, Musk’s stringent cost-cutting measures hint at broader operational challenges as Tesla navigates slower sales and regulatory scrutiny of its automated driving systems. [Link]
2024 Retirement, FA Confidence Survey in Charts (Financial Advisor IQ)
The Employee Benefit Research Institute’s survey indicates a cautiously optimistic outlook among workers and retirees about retirement savings, with a slight boost in confidence despite ongoing concerns about market volatility and inflation. Interest in guaranteed income options and emergency savings has increased, particularly among younger workers under 45. The survey also highlights a growing reliance on professional financial advice and a budding interest in AI-based investment tools. [Link]
Investments
Stocks Trade for 390 Minutes a Day. Increasingly, Only 10 Matter (Bloomberg)
A substantial portion of S&P 500 trades are now executed in the final 10 minutes of trading. About a third of all trades occur in this brief window, up from 27% in 2021. This concentration of trades at the close is tied to passive funds aligning with daily benchmark prices, but it raises concerns about potential price distortions and the broader impact on market dynamics. [Link]
Buffett Rules Out ‘Eye-Popping’ Returns. But Investors Aren’t Listening. (WSJ)
Warren Buffett has tempered expectations for Berkshire Hathaway’s future performance, noting that the conglomerate is unlikely to achieve “eye-popping” growth due to its size. Despite this, Berkshire’s shares have outperformed the market, with Class B shares increasing by 12% this year. This success comes as Buffett navigates the company without his long-time partner Charlie Munger, and ahead of the annual shareholders’ meeting in Omaha, dubbed “Woodstock for Capitalists.” [Link]
Give This Rich Dude $1 or The Onion Disappears Forever (WIRED)
Jeff Lawson, the co-founder of Twilio, recently acquired the satire website The Onion through his new company, Global Tetrahedron. Despite leaving Twilio after being pressured by activist investors, Lawson’s move into media will focus on The Onion’s independence from traffic-driven revenue models. He introduced a unique funding approach by asking readers for voluntary donations. With plans to explore various business models without a hard paywall, Lawson will try to preserve the essence of satire. [Link]
Environmental
Tumble in storage battery costs to boost shift to renewables, says IEA (Reuters)
The International Energy Agency (IEA) predicts a steep reduction in battery costs for energy storage, which will further accelerate the transition from fossil fuels to renewable energy. According to the IEA’s report, total capital costs for battery storage are expected to decrease by up to 40% by 2030. This cost reduction will make renewable energy sources like solar and wind, which require storage to ensure reliability, increasingly competitive against coal and gas-fired power plants. The IEA highlights that integrating solar photovoltaic systems with battery storage is already cost-effective compared to new coal plants in India, and it will soon be cheaper than new coal and gas-fired plants in China and the US, respectively. Additionally, the global energy storage market is projecting a six-fold increase in capacity by 2030, largely driven by advancements in battery technology. [Link]
Where seas are rising at alarming speed (Washington Post)
The American South is experiencing one of the fastest sea level rises on the planet, profoundly affecting coastal communities across eight states. From Texas to North Carolina, tide gauges show a significant increase in sea levels, with many areas observing a rise of over six inches since 2010. This rapid change is straining local infrastructure, elevating insurance costs, and altering daily life. Experts stress that while the focus has traditionally been on preparing for dramatic events like hurricanes, it’s the incremental impact of rising sea levels that poses a longer-term, pervasive threat to these communities. [Link]
Policy
US official urges China, Russia to declare only humans, not AI, control nuclear weapons (Reuters)
Paul Dean, a senior US arms control official, emphasized the importance of human control over nuclear weapons during an online briefing, urging China and Russia to declare a similar stance. The US, along with France and Britain, has committed to ensuring that decisions on the deployment of nuclear weapons remain strictly in human hands, promoting this as a norm of responsible behavior among the permanent members of the UN Security Council. As AI becomes a bigger force, we might have the sequel to Dr. Strangelove, but the bomb isn’t in the hands of humans this time. [Link]
Automatic emergency braking at speeds up to 90mph required under new rule (The Verge)
The US Department of Transportation has mandated that all light-duty vehicles, including passenger cars, SUVs, and pickup trucks, must be equipped with advanced automatic emergency braking (AEB) systems by 2029. This regulation aims to improve safety by enabling vehicles to brake at higher speeds and detect pedestrians at night autonomously. Although current AEB technology helps prevent low-speed collisions, it struggles with high-speed scenarios and detecting pedestrians in dark conditions. This new standard is set against a backdrop of declining traffic fatalities, with a notable reduction in deaths in 2023 compared to the previous year. [Link]
South Carolina No Longer Asking ‘Carolina Squat’ Drivers Nicely To Fix Their Dumb Trucks (Jalopnik)
South Carolina has enacted a ban on the “Carolina Squat,” a vehicle modification where the front end of a truck is lifted much higher than the rear. Initially, the state issued only warnings, but starting next month, actual fines will be imposed. Drivers will face penalties if the front fender of their truck is four inches higher than the rear. This law targets public road safety issues caused by such modifications, like impaired driver visibility and potential hazards to other road users. [Link]
A flurry of new rules from the Biden administration attempt to ban noncompetes, boost overtime pay, and increase refunds for delayed flights (Yahoo News)
The Biden administration has launched new rules designed to improve workers’ earnings and strengthen consumer protections. Key changes include raising the salary threshold for overtime pay, which will benefit workers making less than $43,888 from July 1, and automating refunds for travelers facing significant flight delays or cancellations. Furthermore, the FTC has issued a rule eliminating noncompete agreements, which could foster more business startups and raise employee earnings. Despite these potential benefits, the rule banning noncompetes has sparked lawsuits from various business groups, who argue it exceeds legal boundaries and could disadvantage US companies. [Link]
Housing & Real Estate
Built-for-Rent Construction Continues Booming (Apartment List)
Single-family homes make up two-thirds of the US housing stock, with 16.6% being rented. Built-for-rent (BFR) communities are gaining traction, where single-family homes are constructed specifically for rental purposes. In 2023, these BFR homes saw a notable increase, accounting for 9% of all single-family home starts. Such developments offer amenities typical of multifamily housing and represent a middle-ground option between renting and homeownership. As the demand for affordable homeownership increases due to soaring home prices and high-interest rates, BFRs and other single-family rentals are becoming an increasingly appealing option, particularly in the South and West where most new BFR construction is concentrated. [Link]
Education
Walmart US CEO talks inflation, self-checkout, and paying six-figures to non-college degree workers (ABC News)
Walmart discussed the company’s shift towards hiring more non-college degree workers for high-paying corporate roles. Currently, many of Walmart’s salaried managers, who can earn upwards of $400,000 annually with new stock grant rewards, started as hourly associates. Walmart is actively promoting skills certificates to foster career advancement into roles like software engineering and data science, emphasizing on-the-job training over traditional degrees. [Link]
Sports
Youth Sports: Ahead of the Curve (Sports Business Journal)
Tom Gordon, former MLB pitcher, has been deeply involved with Perfect Game (PG) since retiring from professional baseball. Initially just an events business, PG has transformed into a diverse enterprise, now projecting over $100 million in revenue this year. In the $30 billion youth sports market, baseball and softball are seeing notable increases in participation. PG events have evolved into festival-like experiences with attractions like drone shows and music, drawing massive crowds, such as 40,000 attendees at a recent Houston event. That’s pretty crazy for youth sports! [Link]
Read Bespoke’s most actionable market research by joining Bespoke Premium today! Get started here.
Have a great weekend!
The Bespoke Report — 5/3/24 — May Flowers
To read our weekly Bespoke Report newsletter and access everything else Bespoke’s research platform has to offer, start a two-week trial to Bespoke Premium.


S&P 500 1%+ Gaps Higher
The S&P 500 ETF (SPY) gapped up 1% at the open this morning, so below we wanted to provide a quick summary of how the ETF has typically traded on days when it gaps up 1%+. As shown in the table below, 1%+ gaps higher on a Friday have been the second most frequent of any weekday with 71, trailing only the 80 1%+ gaps higher on Tuesday. On the 71 prior Fridays when SPY has gapped up at least 1%, its median change from the open to close was a further gain of 0.27% with positive returns 59% of the time. SPY has had the best open-to-close performance (+0.50%) after gapping up 1%+ on Wednesdays and the highest consistency of gains (67%).
As for the entire trading day, 90% of the time when SPY gaps up 1%+, it finishes higher on the day. That may sound impressive, but the fact that there is a one in ten chance of the market giving up all of its opening rally means that gains are hardly guaranteed. The worst day of the week in terms of holding 1%+ opening gains has been on Monday as 14% of those days have erased the entire opening gap.

Looking at more recent 1%+ gaps higher, the table below lists the last ten 1%+ opening gaps higher in SPY. Six of the last ten opening gaps have occurred on Tuesdays, but overall it has been a coin flip in terms of the market’s performance from the open to the close. Of the five days where SPY did trade lower from the open to close, it only erased the entirety of its opening gap once (11/1/22).


Bespoke’s Morning Lineup – 5/3/24 – Record Pace of Beats
See what’s driving market performance around the world in today’s Morning Lineup. Bespoke’s Morning Lineup is the best way to start your trading day. Read it now by starting a two-week trial to Bespoke Premium. CLICK HERE to learn more and start your trial.
“Work takes on new meaning when you feel you are pointed in the right direction. Otherwise, it’s just a job, and life is too short for that.” – Tim Cook
Below is a snippet of commentary from today’s Morning Lineup. Start a two-week trial to Bespoke Premium to view the full report.
An apple a day keeps the doctor away, and an Apple (AAPL) earnings report could be just what the market needs to get out of this week with a gain. At current levels, the gains aren’t quite enough to push the market into the black for the week, but if there’s any positive momentum during the trading day (a bigger ask lately), we could get over the hump. Overnight, Asian markets were mixed as the yen rallied from its multi-decade lows earlier in the week. Europe is firmly in positive territory with gains of around 0.50% as banks lead the rally even as Novo Nordisk falls around 5%. Ahead of the 8:30 jobs report, treasury yields are little changed, oil is slightly higher but still below $80, and gold is down fractionally.
Before the April employment report, we wanted to briefly summarize trends surrounding recent reports. The table below summarizes the last two years’ worth of reports including how each came in relative to expectations along with equity market performance on the day of the report. One thing that immediately stands out is that just three of the last 24 reports have come in weaker than expected, and the average margin of “beat” in these 24 reports was 76K. Before Covid, a beat of 76K was very strong. Post-Covid, it’s a normal occurrence.
In terms of the market’s reaction to these reports, the last eight reports have been extremely positive with positive one-day reactions seven times. Before that, things weren’t quite as strong. From May 2022 through April 2023, for example, the S&P 500 declined on the day of the report nine out of twelve times. In terms of recent sector performance, two standouts have been Energy and Financials. Both sectors have reacted positively to 12 of the last 13 reports with average gains of 0.98% and 0.78%, respectively. Consumer Discretionary and Industrials haven’t been slouches either as they notched gains on eleven of the last thirteen non-farm payrolls days.

Getting back to the pace of stronger-than-expected reports, it’s hard to believe but 21 of the last 24 reports have been better than expected. As shown in the chart below, dating back to 2000, we’ve never seen this torrid pace of stronger-than-expected reports. Can the Fed really be talking about rate cuts when the pace of stronger-than-expected reports is this strong?

While better than expected Non-Farm Payrolls reports have been occurring at a pace never seen before, another notable trend lately has been the pace at which reports have been revised lower. When we compare the originally reported change in Non-Farm Payrolls to the current readings after revisions, just nine reports have been revised higher meaning that 15 have been revised lower. Looking back over time, this isn’t necessarily extreme, but it is above the historical average of 12. In other words, Non-Farm Payrolls reports over the last few years have been blistering hot relative to expectations at their initial release, but unlike a fine wine, they haven’t been getting better with age.
Read today’s entire Morning Lineup.

For much more analysis of global equities and economic readings released this morning, read today’s full Morning Lineup with a two-week Bespoke Premium trial.
The Closer – Earnings Deluge, Productivity, Home Inventories – 5/2/24
Log-in here if you’re a member with access to the Closer.
Looking for deeper insight into markets? In tonight’s Closer sent to Bespoke Institutional clients, we begin with a rundown of the deluge of earnings out after the closing bell including the results of Apple (AAPL), Coinbase (COIN), and more (pages 1- 3). We also review today’s productivity data (page 3) before closing with a look into the latest housing inventory figures from realtor.com (pages 4 and 5).

See today’s full post-market Closer and everything else Bespoke publishes by starting a 14-day trial to Bespoke Institutional today!
Chart of the Day – Ford Sheds Light On The EV Narrative
The Triple Play Report — 5/2/24
An earnings triple play is a stock that reports earnings and manages to 1) beat analyst EPS estimates, 2) beat analyst sales estimates, and 3) raise forward guidance. You can read more about “triple plays” at Investopedia.com where they’ve given Bespoke credit for popularizing the term. We like triple plays as an indication that a company’s business is firing on all cylinders, with better-than-expected results and an improving outlook. A triple play is indicative of positive “fundamental momentum” instead of pure fundamentals, and there are always plenty of names with both high and low valuations on our quarterly list.
Bespoke’s Triple Play Report highlights companies that have recently reported earnings triple plays, and it features commentary from management on triple-play conference calls, company descriptions and analysis, and price charts. Bespoke’s Triple Play Report is available at the Bespoke Institutional level only. You can sign up for Bespoke Institutional now and receive a 14-day trial to read this week’s Triple Play Report, which features 31 new stocks. To sign up, choose either the monthly or annual checkout link below:
Bespoke Institutional – Monthly Payment Plan
Bespoke Institutional – Annual Payment Plan

EMCOR (EME), one of nine Industrial companies in this report, is an example of a company that reported an earnings triple play recently.
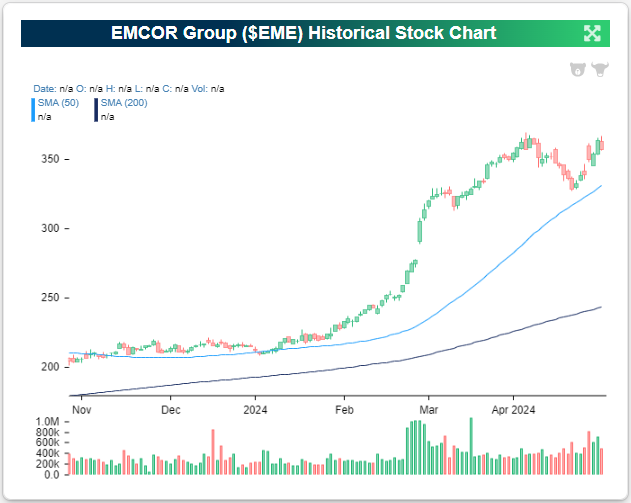
EME has rallied 65.4% so far in 2024 and has traded above its 50 and 200-DMA consistently since the beginning of the year.
Looking at the snapshot below from our Earnings Explorer, EME has beaten both EPS and revenue estimates in all of the last eight quarters, with two triple plays including the most recent one. All of the last eight quarterly earnings have produced positive one-day gains for the stock as well.

With a P/E ratio of 23.4, EME is close to the industry average of 19.5. What’s impressive about EME is that the company has been able to consistently beat EPS estimates by wider margins over the last eight quarters, as shown below. Revenue growth has also been solid.


As a mechanical and electrical infrastructure and building services company, EME benefits from increased infrastructure spending. The company sees high demand in high-tech and traditional manufacturing. The emergence of AI technologies and big data projects are driving growth in network and communications. You can read more about EME and the 30 other triple plays in our newest report by starting a Bespoke Institutional trial today.
Bespoke Investment Group, LLC believes all information contained in these reports to be accurate, but we do not guarantee its accuracy. None of the information in these reports or any opinions expressed constitutes a solicitation of the purchase or sale of any securities or commodities. This is not personalized advice. Investors should do their own research and/or work with an investment professional when making portfolio decisions. As always, past performance of any investment is not a guarantee of future results. Bespoke representatives or clients may have positions in securities discussed or mentioned in its published content.
Bespoke’s Morning Lineup – 5/2/24 – Rebound
See what’s driving market performance around the world in today’s Morning Lineup. Bespoke’s Morning Lineup is the best way to start your trading day. Read it now by starting a two-week trial to Bespoke Premium. CLICK HERE to learn more and start your trial.
“How you finish, is what they will remember.” – Unknown
Below is a snippet of commentary from today’s Morning Lineup. Start a two-week trial to Bespoke Premium to view the full report.
Markets are in rebound mode this morning as they look to recoup the losses from the last hour of trading. Crude oil is higher but still below $80, and the 10-year yield is unchanged. This morning’s economic data has been mixed with jobless claims coming in lower than expected, but Unit Labor Costs rising more than expected (4.7% vs 4.0%) although last quarter’s reading was revised lower. As labor costs increased, Non-Farm Productivity was weaker than expected rising just 0.3% compared to forecasts for an increase of 0.5%.
When people look back on Super Bowl LI, most will only remember that the Patriots won their fifth championship in an unbelievable comeback against the Falcons. The Falcons, who were up by 25 in the second half, won’t be remembered for being so close, but instead for one of the biggest choke jobs in Super Bowl history. At one point in the second half, they had a 99% probability of winning. It was guaranteed.
Similarly for the market, people will not look back on yesterday as being a day when the S&P 500 was up over 1% with less than an hour left in the session. Most people will just remember it as a day when the S&P 500 finished moderately lower (-0.34%), and for those more involved in the day-to-day moves, they’ll remember that the S&P 500 collapsed into the close falling over 1% in the final hour and more than 0.50% in the last ten minutes of trading! As we noted in the Closer last night, at one point yesterday, the S&P 500 had a 99% probability of finishing the day with a gain. Choke job indeed.
What’s even crazier about yesterday’s tank into the close, is that it was the second day in a row where it happened. Below we show the S&P 500’s intraday charts for Tuesday (4/30) and Wednesday (5/1). While the patterns heading into the last ten minutes of both days were almost the opposite, the last ten minutes were nearly identical; The S&P 500 dropped 0.59% in the final ten minutes on Tuesday and 0.60% on Wednesday. These late-day declines are uncommon enough on their own, but to occur on back-to-back days is extremely rare.

The chart below shows streaks where the S&P 500 declined 0.50% or more in the final ten minutes of trading going back to 1985, and there have only been nine other periods where there were back-to-back occurrences (with two extending to an unheard-of third day). The most recent occurrence was in February 2018 during the Volmageddon meltdown. The next before that was in August 2015 when China devalued the yuan and before that August 2011 when the US lost its AAA credit rating from S&P. There were also a few occurrences during the Financial Crisis and also in October 1987 during the market crash. You probably get the point; these types of back-to-back declines normally occur during periods of intense market stress.
For an analysis of how the market performed following these periods, read today’s entire Morning Lineup.

For much more analysis of global equities and economic readings released this morning, read today’s full Morning Lineup with a two-week Bespoke Premium trial.