The Closer – Software Slam, Walmart (WMT) Wows, Dividends – 2/3/26
Log-in here if you’re a member with access to the Closer.
Looking for deeper insight into markets? In tonight’s Closer sent to Bespoke Institutional clients, we start out with a look into the pain trade that is software (pages 1 – 3). We also check in on dividend stocks and the latest batch of earnings (pages 4 & 5). We then finish with a recap of the latest LMI reading (page 6) and the performance of supply chain stocks (page 7).
See today’s full post-market Closer and everything else Bespoke publishes by starting a 14-day trial to Bespoke Institutional today!
The Triple Play Report: 2/2/26
An earnings triple play is a stock that reports earnings and manages to 1) beat analyst EPS estimates, 2) beat analyst sales estimates, and 3) raise forward guidance. You can read more about “triple plays” at Investopedia.com where they’ve given Bespoke credit for popularizing the term. We like triple plays as an indication that a company’s business is firing on all cylinders, with better-than-expected results and an improving outlook. A triple play is indicative of positive “fundamental momentum” instead of pure fundamentals, and there are always plenty of names with both high and low valuations on our quarterly list.
Bespoke’s Triple Play Report highlights companies that have recently reported earnings triple plays, and it features commentary from management on triple-play conference calls, company descriptions and analysis, and price charts. Bespoke’s Triple Play Report is available at the Bespoke Institutional level only. You can sign up for Bespoke Institutional now and receive a 14-day trial to read today’s Triple Play Report. To sign up, choose either the monthly or annual checkout link below:
Bespoke Institutional – Monthly Payment Plan
Bespoke Institutional – Annual Payment Plan
Bespoke Investment Group, LLC believes all information contained in these reports to be accurate, but we do not guarantee its accuracy. None of the information in these reports or any opinions expressed constitutes a solicitation of the purchase or sale of any securities or commodities. This is not personalized advice. Investors should do their own research and/or work with an investment professional when making portfolio decisions. As always, past performance of any investment is not a guarantee of future results. Bespoke representatives or clients may have positions in securities discussed or mentioned in its published content.
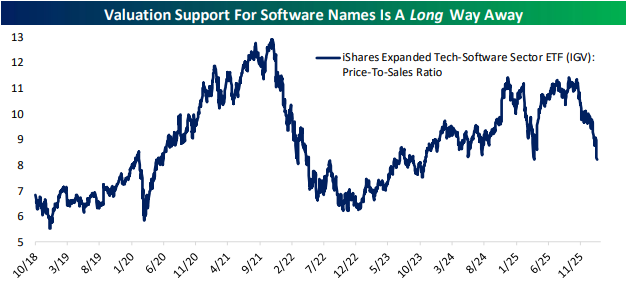
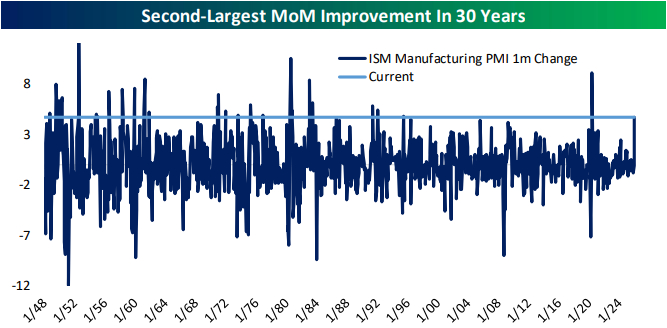
Chart of the Day – What Will You Do For Me Next?
Hardware Flies, Software Dies
Software stocks are getting slammed once again today as there appears to be no floor in the current thinking that AI will crush the software-as-a-service (SaaS) space.
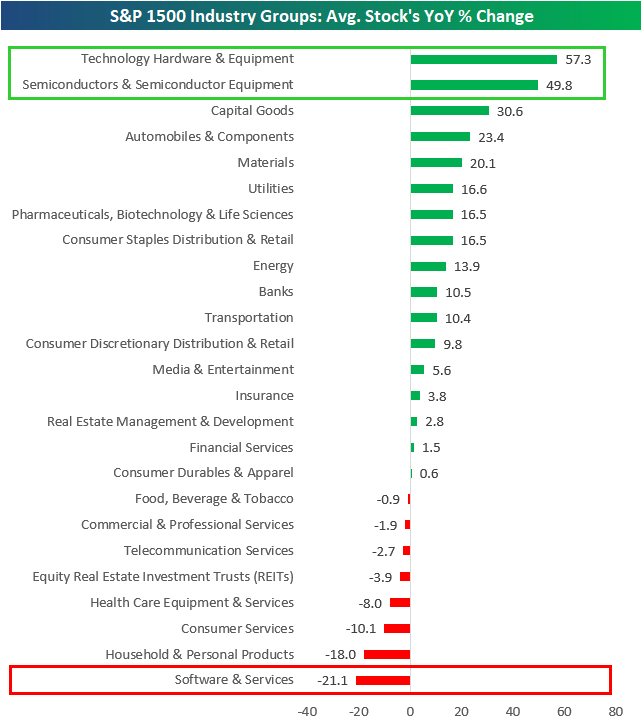
The dichotomy in Tech hardware versus Tech software over the last year has been amazing to watch. As shown below, the average Tech Hardware stock in the S&P 1500 is up 57.3% over the last year, while Semis are up roughly 50%. These two have easily been the best performing groups in the market since last February.
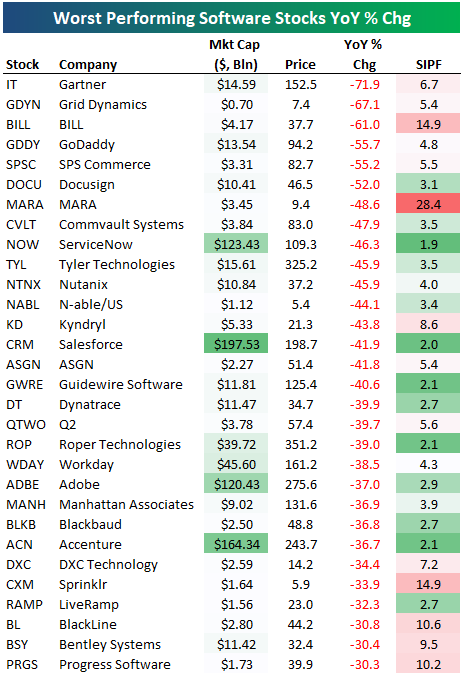
On the other side of the Tech sector sits the Software and Services group, where the average stock is down more than 20% over the last year. Software has now been the worst performing group in the market over this period.
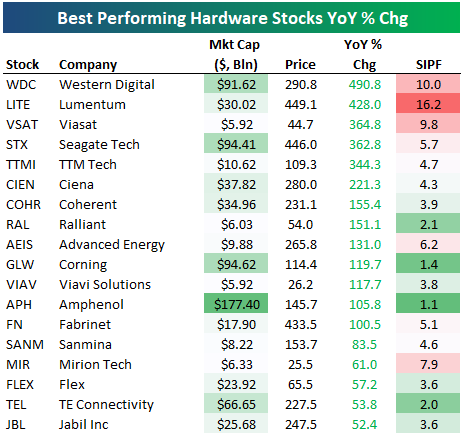
Below is a table showing the best performing stocks in the Tech Hardware group over the last year, where all the names listed are up more than 50% YoY; 13 are up more than 100%.
Conversely, there are thirty stocks in the Software group down more than 30% over the last year, and six are down more than 50%.
It’s ugly out there in software land, and it’s starting to bleed over into the rest of the market as the Nasdaq 100 (QQQ) hasn’t been able to make a new high in over three months.

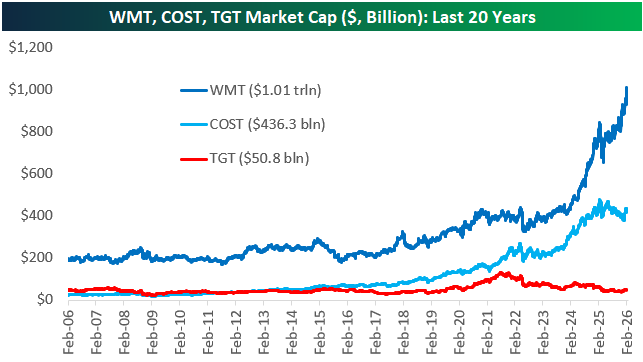
Walmart (WMT): The First Trillion Dollar Big Box
While digital-retail company (and many other things) Amazon (AMZN) crossed the $1+ trillion mark a few years ago, it took until today for its biggest “physical” competitor — Walmart (WMT) — to do the same.
Walmart (WMT) has had an amazing run so far during the 2020s, with its market cap rising from a little more than $300 billion in early 2020 to more than $1 trillion today.
Costco (COST) has seen huge gains during the 2020s as well, while another major player in the big box retail space — Target (TGT) — has gone in the opposite direction lately.
Twenty years ago in early 2006, Walmart had a market cap of $189 billion versus $48.3 billion for Target.
Target’s current market cap of $50.8 billion is just $2.5 billion more than it was twenty years ago, while WMT’s market cap is up 433% to more than $1 trillion.
While WMT was just 3.9x bigger than TGT twenty years ago, it’s nearly 20x as big today.
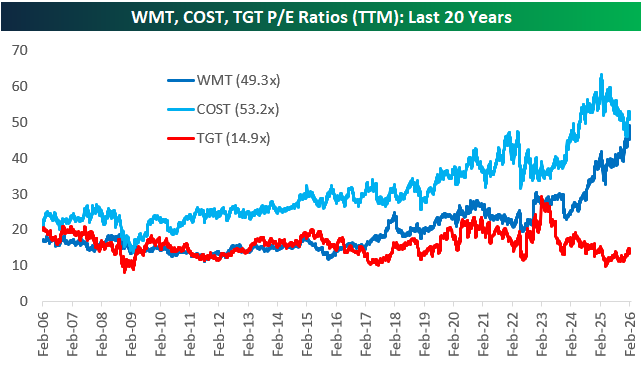
Walmart’s run has been accompanied by EPS and revenue growth, but share price has definitely risen a lot more, causing multiple expansion.
As a trillion dollar company, Walmart also now trades at 49.3 times its trailing 12-month EPS. That sounds more like a high-growth Tech stock multiple rather than a big-box Consumer Staples stock.
Target (TGT), in the meantime, has seen its P/E multiple fall down to just 14.9x, while COST’s P/E of 53.2x is even higher than WMT’s.
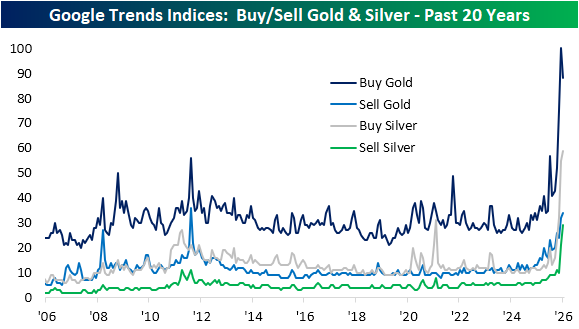
Precious Search Interest
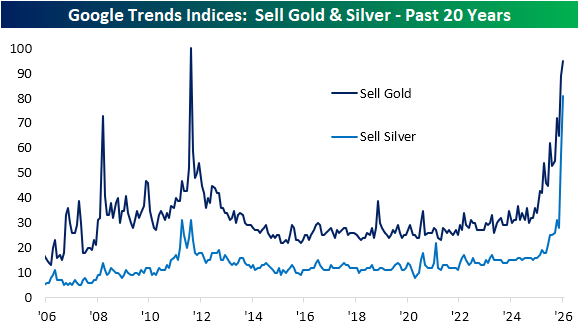
Today has been another volatile session for gold and silver prices, with the former up over 7% as of this writing and the latter up well over 15% versus yesterday’s close.
The huge move higher (and lower) in precious metals has resulted in surging interest from consumers based on Google search interest.
Google Trends tracks and indexes search interest on Google’s search engine for a given word or phrase over a given time period. Readings of 100 indicate the peak for search interest, readings of 50 would be half of that peak, and so on.
As shown below, the latest surge in gold and silver prices has corresponded with a surge in search interest for both “sell gold” and “sell silver.”
For gold, search interest is approaching August 2011 records, whereas the reading for sell silver is now far and away at record highs. In other words, people have record or near record interest in selling their precious metals.
Amazingly, though, search interest for “buy gold” and “buy silver” has also surged to record highs that are at levels much higher than the “sell” version of the phrase. As prices have skyrocketed, more people seem to be interested in buying gold and silver than selling them.
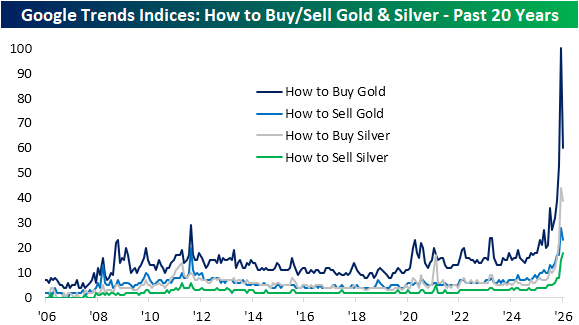
We also like to look at “How to” searches. These can proxy first time buyers or sellers, or alternatively, more casual investor interest. Again, these indices are broadly elevated and hit new records by massive margins recently. As shown below, searches for “how to buy gold” have skyrocketed as gold prices have gone parabolic, while the “how to sell” versions have also jumped but not by nearly as much.
Bespoke’s Morning Lineup – 2/3/26 – Europe Rises to the Top
See what’s driving market performance around the world in today’s Morning Lineup. Bespoke’s Morning Lineup is the best way to start your trading day. Read it now by starting a two-week trial to Bespoke Premium. CLICK HERE to learn more and start your trial.
“The way we do things is to begin.” – Horace Greeley

Below is a snippet of commentary from today’s Morning Lineup. Start a two-week trial to Bespoke Premium to view the full report.
Make sure to check out Paul Hickey on CNBC’s Squawk on the Street today at 10 AM!
Futures on the S&P 500 and Nasdaq are slightly higher this morning, as the Dow trades slightly lower. Nasdaq futures are leading the gains following a positive earnings report from Palantir (PLTR), which has the stock trading up over 10%. Treasury yields are moving higher again as the 10-year yield sits just under 4.29%, and crude oil is slightly higher. Precious metals are really in rally mode as Gold trades up over 6% and Silver is up more than twice that in percentage terms. If you were looking for things to calm down in that space, don’t hold your breath.
The only economic report on the calendar this morning is JOLTS at 10 AM, but right before that, at 9:40, Fed Governor Bowman will be speaking at a WSJ conference. On the earnings front, some of the key companies reporting after the close will be AMD, Amgen (AMGN), and Mondelez (MDLZ)
So much for that sell-off in Asian stocks to start the week. Overnight, the Nikkei surged nearly 4% to a new all-time high. Not to be outdone, the KOSPI spiked nearly 7% briefly causing another halt to trading, after Monday’s downside halt. Both Palantir’s (PLTR) positive reaction to earnings and the US India trade deal have acted as catalysts for the gains. India’s Sensex also rose over 2.5% in the wake of the trade deal, which would cut tariffs on Indian imports to 18%, and India would agree to stop buying Russian oil. All of this news overshadowed a rate hike in Australia from the RBA, which was widely expected, but the central bank did suggest tighter policy could continue as inflation accelerates.
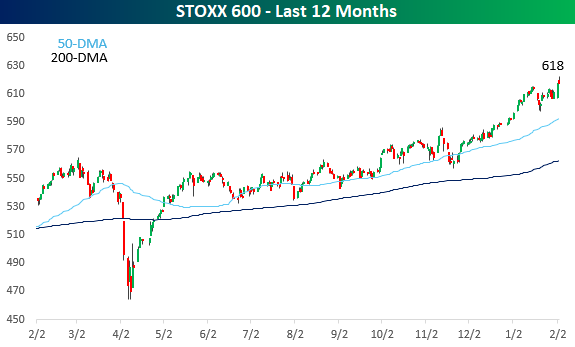
Yesterday, it was Europe benefiting from its lack of technology exposure, but this morning, that isn’t the case. While stocks in the region are generally positive on the session, the gains are much more muted relative to Asia. The STOXX 600 is barely holding on to gains while the UK and France are both in the red.
After two weeks of sideways trading, European stocks went into lift-off mode yesterday as the STOXX 600 surged more than 1% to a new all-time high. This morning, the European benchmark index added to those gains before pulling back modestly, although it’s still up for the day. YTD, the STOXX is already up over 4%, or more than twice the 1.9% gain for the S&P 500.
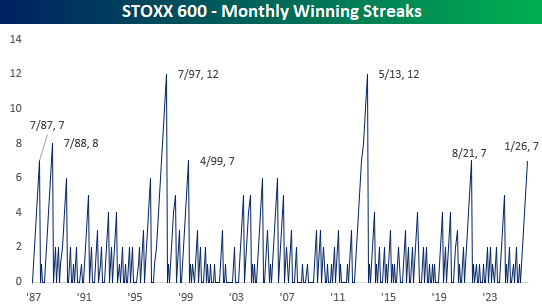
Like the Dow Jones, which has had nine months in a row of gains, the STOXX 600 has been up for seven straight months. That ranks as tied for the longest streak since May 2013 and tied for the fourth-longest on record.
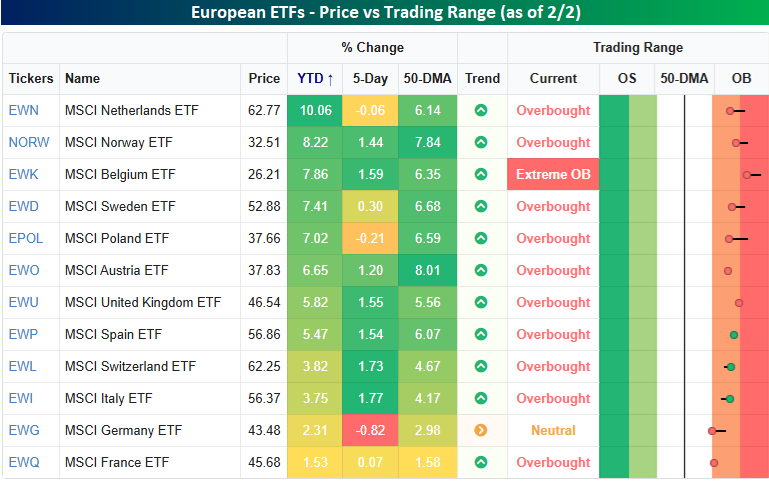
Looking at individual country performances within Europe, the snapshot below from our Trend Analyzer shows the performance of country ETFs on the continent. Of the 12 ETFs shown, all of them are up YTD, and France is the only one underperforming the S&P 500. Most of the countries have outperformed the US by a wide margin. The Netherlands (EWN) ETF is up over 10% already this year, and seven other countries have gained at least 5%. Most of the countries are also comfortably above their respective 50-day moving averages and well into short-term overbought territory. The only exception is Germany (EWG), which is also down the most over the last week (-0.82%).
It’s also interesting to note that most of the strength in European stocks this year hasn’t been coming from major economies like Germany, France, Italy, and Spain. They’re all at or near the bottom of the performance list. Instead, it’s the less talked about countries like the Netherlands, Norway, Belgium, and Sweden leading the way.
The Closer – Earnings, PMIs, Smart vs. Dumb Money – 2/2/26
Log-in here if you’re a member with access to the Closer.
Looking for deeper insight into markets? In tonight’s Closer sent to Bespoke Institutional clients, we lead off with commentary regarding today’s volatility across assets in addition to the damage that has been done to some technical pictures given these moves (pages 1 and 2). Next, we review the odd bear market for software stocks (pages 2 and 3). We follow up with earnings recaps and a quick review of today’s economic data (pages 4 and 5),
See today’s full post-market Closer and everything else Bespoke publishes by starting a 14-day trial to Bespoke Institutional today!
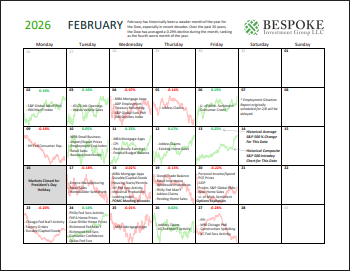
Bespoke Market Calendar — February 2026
Please click the image below to view our February 2026 market calendar. This calendar includes the S&P 500’s historical average percentage change and average intraday chart pattern for each trading day during the upcoming month. It also includes market holidays and options expiration dates plus the dates of key economic indicator releases.Click here to view Bespoke’s premium membership options.
Q4 2025 Earnings Conference Call Recaps: Meta Platforms (META)
Bespoke’s Conference Call Recaps use AI to summarize lengthy earnings calls. The commentary below is AI-generated and then edited by Bespoke for quality control. As always, none of these summaries should be construed as recommendations to buy or sell any securities, and investors should do their own research and/or consult with a financial professional before making any investment decisions.
Our latest recap available to Bespoke subscribers covers Meta Platforms’ (META) Q4 2025 earnings call.
![]()
Meta Platforms (META) builds the social fabric of the internet through its Family of Apps, including Facebook, Instagram, WhatsApp, and Threads. With over 3.5 billion daily users, Meta makes communication tools and advanced AI models, monetizing this massive engagement via a sophisticated advertising ecosystem. While Meta is known as a social media giant, it is developing into a deep technology company, now looking to pioneer what it calls personal superintelligence and making proprietary silicon and global-scale energy infrastructure to power the next generation of computing. In Q4, revenue grew 24% YoY to $59.9 billion, funded by record-breaking holiday ad demand. However, the focal point was a 2026 capital expenditure guide of $115–$135 billion, nearly double 2025 levels, to build out Meta Superintelligence Labs and a new organization, Meta Compute. Zuckerberg is pivoting from the metaverse toward AI-powered wearables, noting that Ray-Ban glasses sales tripled last year. Internally, Meta is seeing a macro-shift in productivity. The company claims that AI coding tools have increased engineer output by 30%, allowing single contributors to handle tasks previously requiring entire teams. After reporting a triple play, the stock rose 10.4% on 1/29…
Continue reading our Conference Call Recap for META by becoming a Bespoke Institutional subscriber. You can sign up for Bespoke Institutional now and receive a 14-day trial to read our newest Conference Call Recap. To sign up, choose either the monthly or annual checkout link below: