Bespoke’s Morning Lineup — 12/19/24
See what’s driving market performance around the world in today’s Morning Lineup. Bespoke’s Morning Lineup is the best way to start your trading day. Read it now by starting a two-week trial to Bespoke Premium. CLICK HERE to learn more and start your trial.
“Being very early and being wrong look exactly the same 99% of the time.” – Seth Klarman

Below is a snippet of commentary from today’s Morning Lineup. Start a two-week trial to Bespoke Premium to view the full report.
As shown below, the S&P 500 was sitting slightly in overbought territory heading into the trading day yesterday, but it finished below its 50-day moving average.

An already oversold 10-day advance/decline (A/D) line for the S&P got even more oversold yesterday with just 19 stocks in the index up on the day versus 483 that were down. Yesterday’s negative breadth extended the streak of days with more decliners than advancers to 13 straight; a record losing streak since 1990.
As shown below, the 10-day A/D line is now the most oversold it’s been since the bear market lows in October 2022.

The Closer – A Horrible Fed Day, Equal Weight, Construction – 12/18/24
Log-in here if you’re a member with access to the Closer.
Looking for deeper insight into markets? In tonight’s Closer sent to Bespoke Institutional clients, we begin with a dive into the FOMC including the changes to forecasts (pages 1 and 2) and the huge drop in equities in response (page 3). We also check in on the performance of equal weight stocks and the dollar (page 4). We then switch to a recap of today’s residential construction figures (page 5) and the latest EIA data (page 6).

See today’s full post-market Closer and everything else Bespoke publishes by starting a 14-day trial to Bespoke Institutional today!
Bespoke Baskets Update — December 2024
Chart of the Day – Losing Streaks Highlighting Bad Breadth
Fixed Income Weekly — 12/18/24
Searching for ways to better understand the fixed income space or looking for actionable ideas in this asset class? Bespoke’s Fixed Income Weekly provides an update on rates and credit each week. We start off with a fresh piece of analysis driven by what’s in the headlines or driving the market in a given week. We then provide charts of how US Treasury futures and rates are trading, before moving on to a summary of recent fixed-income ETF performance, short-term interest rates including money market funds, and a trade idea. We summarize changes and recent developments for a variety of yield curves (UST, bund, Eurodollar, US breakeven inflation, and Bespoke’s Global Yield Curve) before finishing with a review of recent UST yield curve changes, spread changes for major credit products and international bonds, and 1-year return profiles for a cross-section of the fixed income world.

Our Fixed Income Weekly helps investors stay on top of fixed-income markets and gain new perspectives on the developments in interest rates. You can sign up for a Bespoke research trial below to see this week’s report and everything else Bespoke publishes for the next two weeks!
Click here and start a 14-day free trial to Bespoke Institutional to see our newest Fixed Income Weekly now!
Bespoke’s Morning Lineup – 12/18/24 – Dow Looks to Avoid 10 In a Row
See what’s driving market performance around the world in today’s Morning Lineup. Bespoke’s Morning Lineup is the best way to start your trading day. Read it now by starting a two-week trial to Bespoke Premium. CLICK HERE to learn more and start your trial.
“All great and honorable actions are accompanied with great difficulties, and both must be enterprised and overcome with answerable courage.” – William Bradford
Below is a snippet of commentary from today’s Morning Lineup. Start a two-week trial to Bespoke Premium to view the full report.
To view yesterday’s CNBC segment previewing the Fed decision today, click on the image below.

There’s a positive tone in futures this morning, but what makes today slightly different from the last two weeks is that the Dow futures are slightly outperforming on the session, and the equal weighted S&P 500 is up slightly more than the cap-weighted index. Could this be the long-awaited day of positive breadth where the Dow avoids a 10-day losing streak? There’s still a long way to go between now and the closing bell, and in between, we still have a Fed decision to get through.
After today’s FOMC decision, we’ll also get important policy announcements from the BoJ on Thursday and PBoC on Friday. Ahead of these meetings from the two largest central banks in Asia, equities in the region were mixed with Japan down 0.7% and China up by a similar magnitude. In Europe, trading has taken on a more broadly positive, although muted, tone. The STOXX 600 is up 0.2% after headline CPI for the Euro region fell 0.3% which was right in line with expectations, and Core CPI fell 0.6% which was also right in line with estimates.
Back here in the US, the only economic reports on the calendar are Building Permits and Housing Starts. Both indicators have been weak in recent months partly due to the hurricanes in the southeast. While economists were expecting a rebound, the results relative to expectations were mixed as Building Permits came in significantly better than expected while Housing Starts missed by over 100K. Much of that weakness was a result of weakness in multifamily units.
Speaking of housing, the homebuilder ETF (XHB) looks a lot like many other charts out there as there has been a consistent pattern of selling ever since December started. In the case of XHB, the selling started a little earlier on the Monday before Thanksgiving. Since then, if the market has been open for trading investors have been selling homebuilder stocks. If there’s any consolation to the recent weakness, it’s that XHB has remained above its 50-DMA, and the weakness has been on light volume. Since its high on 11/25, daily volume in XHB has been 39% less than it was in the prior eleven months.
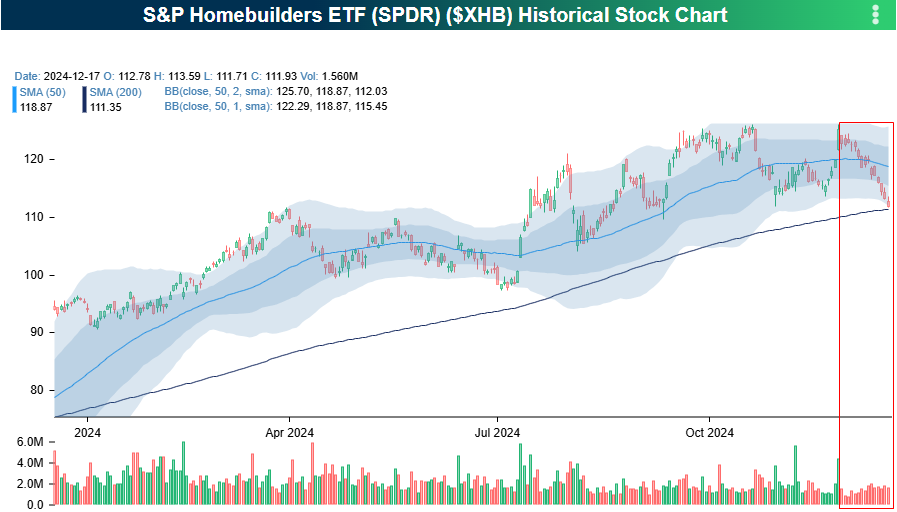
As shown in the chart above, there has been a consistent trend of red bars in the chart of XHB over the last 15 trading days. In the entire history of the ETF, there has never been a longer streak where the ETF closed the session lower than it opened. If you think your kids can be persistent in asking for a specific holiday gift, they have nothing on the relentless selling in the homebuilders.

The Closer – Retail Sales, EMFX, 20s Tail – 12/17/24
Log-in here if you’re a member with access to the Closer.
Looking for deeper insight into markets? In tonight’s Closer sent to Bespoke Institutional clients, we lead off with a review of the latest retail sales report (pages 1 and 2) in addition to Chile central bank and EMFX happenings (page 3). We then review the fourth straight tailing 20-year bond sale (page 4).

See today’s full post-market Closer and everything else Bespoke publishes by starting a 14-day trial to Bespoke Institutional today!
Chart of the Day – 10, 9, 8…
Bespoke’s Morning Lineup – 12/17/24 – Gwen
See what’s driving market performance around the world in today’s Morning Lineup. Bespoke’s Morning Lineup is the best way to start your trading day. Read it now by starting a two-week trial to Bespoke Premium. CLICK HERE to learn more and start your trial.
“If we all worked on the assumption that what is accepted as true is really true, there would be little hope of advance.” – Orville Wright
Below is a snippet of commentary from today’s Morning Lineup. Start a two-week trial to Bespoke Premium to view the full report.
Equity futures are firmly lower this morning even after headline Retail Sales for November came in better than expected. The S&P 500 is indicated to open down about 0.4% following more modest declines in Europe this morning and Asia overnight. There are additional economic data points on the calendar for today, including Industrial Production, Capacity Utilization, Business Inventories, and Homebuilder Sentiment, but the main area of focus will shift to tomorrow’s Fed decision and subsequent press conference where the market increasingly expects a more hawkish tone and dialing back of rate cut expectations.
There are too many memorable episodes to name when it comes to the show Seinfeld, but 27 years ago tomorrow (12/18/1997), the famous Festivus episode aired during the show’s last season. Everyone remembers the main Festivus plotline of the episode and the infamous airing of grievances. Another episode subplot concerned Jerry and his girlfriend Gwen, whom he met at his friend Tim Whatley’s (played by Bryan Cranston) Hanukkah party. As they see each other more often, and Jerry introduces Gwen to Kramer, he realizes that in some situations and lighting (like when he first met her at Tim’s party) Gwen looks great. In other situations and lighting, though, she looks entirely different and less attractive.
Gwen is today’s stock market. After closing within 0.3% of its all-time high yesterday and posting a month-to-date gain of 0.7% so far, the market looks great this month, just like a typical December.

Looking at it in another light, though, things look very different. On an equal-weighted basis, stocks in the S&P 500 are down an average of 3.2% this month, and the S&P 500 Equal Weight ETF (RSP) has closed lower than it opened for eleven straight days taking it below the 50-day moving average in the process.

Similarly, the Dow Jones Industrial Average has been showing similar weakness. Like the equal-weight S&P 500, the Dow has been consistently trading lower this month, and while it has managed to maintain its uptrend and hold above its 50-DMA for now, it has also traded consistently lower for most of the month.

In fact, through yesterday’s close, the ETF that tracks the Dow (DIA) has traded down on the day for eight straight sessions. That’s tied with three other streaks for the longest in the ETF’s history, and the three others that lasted as long ended in June 2006, August 2011, and most recently June 2018. There’s a lot to be thankful for in the market this year, but unless the internals can pull off some major feats of strength in the coming days, investors will have plenty of grievances to air at this year’s Festivus table.

The Closer – Fiscal Stress, Central Banks, Commodities – 12/16/24
Log-in here if you’re a member with access to the Closer.
Looking for deeper insight into markets? In tonight’s Closer sent to Bespoke Institutional clients, we lead off with a look into Canadian political stress and corresponding market moves (page 1). We also check in on our Fedspeak Monitor Index (page 2) in addition to a preview of the busy week of central bank happenings (page 3). After checking in on commodity prices (page 4), we preview this week’s Treasury auctions (page 5) and look at the latest positioning data (pages 6-9).

See today’s full post-market Closer and everything else Bespoke publishes by starting a 14-day trial to Bespoke Institutional today!