International Dividend Stocks Lag
It’s been three months since the Presidential election, and in that time the S&P 500 ( SPY) has returned a solid 6.59%. That outperformance has been driven by large cap growth, while value indices have lagged behind. US dividend-focused ETFs have likewise lagged the broad market to a degree, but they are still handily outperforming their international peers. In the chart below, we show the total return of US and International dividend ETFs from multiple families of funds. Of course, each of these ETFs have slightly different methodologies. For example, whereas the SPDR S&P Dividend ETF (SDY) is perhaps the most restrictive, only including stocks that have raised dividends for at least 20 years in a row, others like the Invesco Dividend ETFs (PID and PFM) have easier standards requiring only 5 years of dividend history while the Vanguard High Dividend ETFs (VYMI and VYM) takes the stocks with the highest forecasted yields for the 12 months ahead. Regardless of methodology, there has been a clear distinction between US and internationals save for one US ETF. The SPDR S&P Dividend ETF (SDY) is down 2.5% in the past three months, which is the worst performance of those listed.
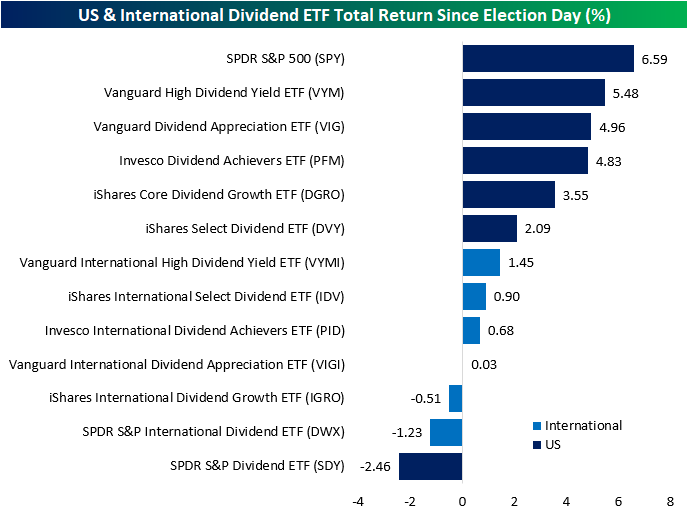
As is the case with equities in a broader sense, the recent underperformance of international stocks relative to the US is nothing new and consistent with longer term trends. In the charts below, we show the relative strength over the past five years for US versus international dividend ETFs grouped by their issuer/methodologies. No matter which way it is chopped up, international dividend stocks have underperformed US counterparts for much of the past few years. Currently, those relative strength lines are testing 5 year lows for the likes of the Invesco ETFs and Vanguard High Yield ETFs.

Like this post? Join our complimentary Dividend Discovery email newsletter to receive a dividend-centric post in your inbox a couple of times per week. If you’re interested in dividend stocks and ETFs, this newsletter is for you! CLICK HERE to sign up with just your email or click on the image below.

Chart of the Day: Chocolate For The Long Run
Q4 2024 Earnings Conference Call Recaps: Palantir (PLTR)
Bespoke’s Conference Call Recaps use AI to summarize lengthy earnings calls. The commentary below is AI-generated and then edited by Bespoke for quality control. As always, none of these summaries should be construed as recommendations to buy or sell any securities, and investors should do their own research and/or consult with a financial professional before making any investment decisions.
Our latest recap available to Bespoke subscribers covers Palantir’s (PLTR) Q4 2024 earnings call.
![]()
Palantir (PLTR) is a leader in big data and AI, providing advanced software platforms, including its Artificial Intelligence Platform (AIP), that enable government and commercial clients to analyze data and make critical decisions. Known for its flagship platforms Foundry, Gotham, and AIP, PLTR delivers in complex fields such as defense, national security, finance, and healthcare. PLTR’s Q4 was defined by explosive US commercial growth, with revenue up 64% YoY and total deal value hitting $1.8 billion given AI adoption. US government revenue was up 45%, fueled by expanding military AI applications like Project Maven. The Warp Speed manufacturing AI initiative is gaining traction, while international growth lags, particularly in Europe. Management emphasized the AI arms race with China, speaking to the company’s role in national security. PLTR reported its third consecutive triple play, and the stock surged another 24% on 2/4 as a result. Since the beginning of 2024, the stock has grown 525%…
Continue reading our Conference Call Recap for PLTR by becoming a Bespoke Institutional subscriber. You can sign up for Bespoke Institutional now and receive a 14-day trial to read our newest Conference Call Recap. To sign up, choose either the monthly or annual checkout link below:
Q4 2024 Earnings Conference Call Recaps: Chipotle Mexican Grill (CMG)
Bespoke’s Conference Call Recaps use AI to summarize lengthy earnings calls. The commentary below is AI-generated and then edited by Bespoke for quality control. As always, none of these summaries should be construed as recommendations to buy or sell any securities, and investors should do their own research and/or consult with a financial professional before making any investment decisions.
Our latest recap available to Bespoke subscribers covers Chipotle’s (CMG) Q4 2024 earnings call.
![]()
Chipotle (CMG) is a fast-casual restaurant chain specializing in customizable burritos, bowls, tacos, and salads. With over 3,400 locations and a growing presence internationally, CMG has set itself apart as a go-to spot for a range of customer needs. The company is a leader in digital ordering, loyalty programs, and drive-thru formats (Chipotlanes), offering insights into consumer dining trends, digital engagement, and labor efficiency in the restaurant industry. CMG posted 13% revenue growth to $2.8 billion, with comp sales up 5.4% and 4% transaction growth despite holiday volatility. The company continues to push throughput improvements, with general manager (GM) turnover at historic lows and new kitchen equipment like produce slicers, dual-sided planchas, and AI-assisted digital-make lines. Chipotlanes now make up 25% of locations, while international expansion accelerates in Canada and the Middle East. Inflation, avocado price swings, and potential tariffs pose headwinds, but digital marketing and AI-driven personalization are expected to sustain traffic. Chipotle remains bullish on reaching 7,000+ locations and surpassing $4M in AUV long-term. On mixed results, shares fell 2.6% on 2/5…
Continue reading our Conference Call Recap for CMG by becoming a Bespoke Institutional subscriber. You can sign up for Bespoke Institutional now and receive a 14-day trial to read our newest Conference Call Recap. To sign up, choose either the monthly or annual checkout link below:
Q4 2024 Earnings Conference Call Recaps: Alphabet (GOOGL)
Bespoke’s Conference Call Recaps use AI to summarize lengthy earnings calls. The commentary below is AI-generated and then edited by Bespoke for quality control. As always, none of these summaries should be construed as recommendations to buy or sell any securities, and investors should do their own research and/or consult with a financial professional before making any investment decisions.
Our latest recap available to Bespoke subscribers covers Alphabet’s (GOOGL) Q4 2024 earnings call.
![]()
Alphabet (GOOGL) is the parent company of Google and a leader in AI with DeepMind and its Gemini AI, cloud computing, digital advertising, and consumer technology. It dominates global search through Google Search and is a powerhouse in online video with YouTube. It serves billions worldwide, from everyday users to major corporations. Other ventures like Waymo (autonomous vehicles) and quantum computing research are also notable. For Q4, GOOGL posted revenue of $96.5 billion, up 12% YoY. AI was a major theme. Gemini 2.0 launched, AI Overviews expanded, and AI-powered search usage increased. YouTube ad revenue grew 14% to $10.5 billion, fueled by election-related spending and Shorts monetization progress. Capex is set at $75B for 2025, reflecting heavy AI and infrastructure investments, which came as a bit of a surprise as the stock fell 7.25% on 2/5. Waymo completed 4M rides and is expanding into Austin, Atlanta, and Tokyo…
Continue reading our Conference Call Recap for GOOGL by becoming a Bespoke Institutional subscriber. You can sign up for Bespoke Institutional now and receive a 14-day trial to read our newest Conference Call Recap. To sign up, choose either the monthly or annual checkout link below:
Bespoke’s Morning Lineup – 2/6/25 – Guidance Takes a Turn
See what’s driving market performance around the world in today’s Morning Lineup. Bespoke’s Morning Lineup is the best way to start your trading day. Read it now by starting a two-week trial to Bespoke Premium. CLICK HERE to learn more and start your trial.
“Status quo, you know, is Latin for ‘the mess we’re in’.” – Ronald Reagan

Below is a snippet of commentary from today’s Morning Lineup. Start a two-week trial to Bespoke Premium to view the full report.
Given the sheer volume of earnings reports at this point in the reporting period, it’s hard to keep track of everything hitting the tape. But going through the various headlines since yesterday’s close, we’ve noticed a pickup in the number of companies lowering guidance. Since yesterday’s close, we’ve seen 22 companies lower forecasts going forward compared to just six raising guidance. It’s only one day, but we’ll watch to see if this starts becoming more of a trend. Despite the generally weaker tone from individual companies, equity futures are modestly higher on the day, although they are well off their overnight highs.
Along with equity prices, gold has also been strong. Prices are up again this morning, and if these gains hold throughout the trading day it would be the sixth straight day of record closing highs for the SPDR Gold Trust ETF (GLD) which would be tied for the longest streak of record closing highs since 2011. If you think the stock market has done well over the last year, GLD has rallied over 40%! In the shorter term, after breaking out of its three-month range in late January, GLD has traded higher every day since then.

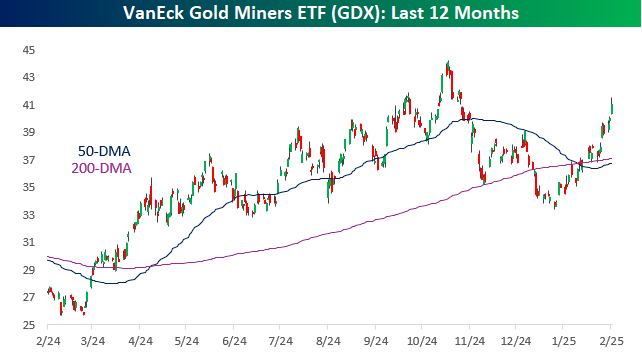
Given the strength in the commodity, it’s no surprise that gold mining stocks have been strong, but maybe not quite as strong as you would expect. Over the last year, the VanEck Gold Miners ETF (GDX) has rallied 50%, but unlike GLD, it is still well below its 52-week high from late October, when the commodity peaked before the most recent consolidation phase. So, in some ways it has some catching up to do!
From a long-term perspective, gold mining stocks have underperformed the commodity. The chart below shows the relative strength of GDX vs GLD over the last ten years. From 2016 through 2022, gold miners were pretty consistent outperformers of the commodity, but since the middle of 2022, there’s been a shift where the commodity has started to outperform.

The Closer – Refunding & Fair Value, QT, Fedspeak – 2/5/25
Log-in here if you’re a member with access to the Closer.
Looking for deeper insight into markets? In tonight’s Closer sent to Bespoke Institutional clients, we begin with an overview of the latest refunding plans from the US Treasury in addition to a look at fair value of yields (page 1). We then provide an update on QT and Fedspeak (page 2) followed by a rundown of the latest service PMI data (page 3). After running through tonight’s earnings reports (page 4), we finish with a recap of the latest EIA data (page 5).

See today’s full post-market Closer and everything else Bespoke publishes by starting a 14-day trial to Bespoke Institutional today!
The Triple Play Report — 2/5/25
An earnings triple play is a stock that reports earnings and manages to 1) beat analyst EPS estimates, 2) beat analyst sales estimates, and 3) raise forward guidance. You can read more about “triple plays” at Investopedia.com where they’ve given Bespoke credit for popularizing the term. We like triple plays as an indication that a company’s business is firing on all cylinders, with better-than-expected results and an improving outlook. A triple play is indicative of positive “fundamental momentum” instead of pure fundamentals, and there are always plenty of names with both high and low valuations on our quarterly list.
Bespoke’s Triple Play Report highlights companies that have recently reported earnings triple plays, and it features commentary from management on triple-play conference calls, company descriptions and analysis, and price charts. Bespoke’s Triple Play Report is available at the Bespoke Institutional level only. You can sign up for Bespoke Institutional now and receive a 14-day trial to read this week’s Triple Play Report, which features 23 new stocks. To sign up, choose either the monthly or annual checkout link below:
Bespoke Institutional – Monthly Payment Plan
Bespoke Institutional – Annual Payment Plan

Celestica (CLS) is an example of a company that recently reported an earnings triple play; its fourth triple play in the last five quarters. The stock was up 13.6% the following day (1/30), stacking up the gains after the previous quarter’s earnings reaction that swung shares 18.2% higher. Since last September, CLS has risen close to 250%. Zooming further out, the stock has been a “10-bagger” (up 1,000%+) since the start of 2023.

Looking at the snapshot below from our Earnings Explorer, CLS results have been very consistent against estimates since 2019. Confidence has only been growing with the number of triple plays reported recently.

Celestica specializes in electronic manufacturing and has seen growth from its Advanced Technology Solutions (ATS) and Connectivity & Cloud Solutions (CCS) segments, particularly benefiting from AI-driven demand in its hyperscale and networking businesses. AI-driven infrastructure investments are scaling faster than expected, and hyperscalers are prioritizing liquid cooling and high-density networking hardware. CLS is gaining share in AI server and networking deployments, which it expects to drive double-digit CCS growth in 2025. Geopolitical tensions and increased military budgets are also driving sustained demand in defense electronics and satellite communications. You can read more about CLS and the 22 other triple plays we covered in our newest report by starting a Bespoke Institutional trial today.
Bespoke Investment Group, LLC believes all information contained in these reports to be accurate, but we do not guarantee its accuracy. None of the information in these reports or any opinions expressed constitutes a solicitation of the purchase or sale of any securities or commodities. This is not personalized advice. Investors should do their own research and/or work with an investment professional when making portfolio decisions. As always, past performance of any investment is not a guarantee of future results. Bespoke representatives or clients may have positions in securities discussed or mentioned in its published content.
Chart of the Day – Triple Plays Reacting Positively
Bespoke’s Morning Lineup – 2/5/25 – The Overbought, the Neutral, and Tech
See what’s driving market performance around the world in today’s Morning Lineup. Bespoke’s Morning Lineup is the best way to start your trading day. Read it now by starting a two-week trial to Bespoke Premium. CLICK HERE to learn more and start your trial.
“The reason we are so excited about the AI opportunity is we know we can drive extraordinary use cases because the cost of actually using it is going to keep coming down” – Sundar Pichai
Below is a snippet of commentary from today’s Morning Lineup. Start a two-week trial to Bespoke Premium to view the full report.
US equity futures are lower this morning but off their overnight lows. Weakness is concentrated in the Nasdaq where negative earnings reports are weighing on some notable names. Crude oil and Treasury yields are lower on the morning while gold makes a run for $2,900 per ounce.
For Alphabet (GOOGL), the last two months must feel like Charlie Brown trying to kick the football. For several weeks, the stock made multiple attempts to break above $200, and each time it got there, the rug was pulled out from under it and it finished back below that level by the end of the day. Last week, GOOGL finally got and stayed above $200. Yesterday, the stock traded up more than 2.5% to a record high. Then the Q4 earnings report hit.
While the company reported better-than-expected EPS, revenues came in slightly weaker than expected due to slower-than-expected growth in its cloud services business. The company also shocked the street by saying that it plans to spend approximately $75 billion on cap ex this year, up over 40% from 2024 and significantly above forecasts of around $59 billion.
While company officials attributed the slowdown in cloud sales growth to a problem with capacity rather than demand, and most other divisions within the company saw better-than-expected results, shares of GOOGL immediately traded lower in after-market trading. While the stock is modestly off its overnight lows, it’s still down 7.2% relative to Tuesday’s close. As shares open for trading this morning, rather than being at record highs, shares of GOOGL will be struggling to hang on to their 50-day moving average.
