Q4 2024 Earnings Conference Call Recaps: Cloudflare (NET)
Bespoke’s Conference Call Recaps use AI to summarize lengthy earnings calls. The commentary below is AI-generated and then edited by Bespoke for quality control. As always, none of these summaries should be construed as recommendations to buy or sell any securities, and investors should do their own research and/or consult with a financial professional before making any investment decisions.
Our latest recap available to Bespoke subscribers covers Cloudflare’s (NET) Q4 2024 earnings call.
![]()
Cloudflare (NET) provides a global network infrastructure that enhances security, performance, and reliability for websites, applications, and enterprise networks. The company’s platform offers a suite of services, including DDoS protection, Zero Trust security, content delivery, and AI-driven computing with Cloudflare Workers. NET serves small developers to Fortune 100 enterprises and government agencies. This quarter, NET delivered $459.9M in revenue, up 27% YoY, driven by strong enterprise adoption and record growth in large customers. AI continues to be a major growth catalyst, with Cloudflare Workers and AI inference services picking up steam. The company signed its largest contract ever, a $20M five-year deal with a Fortune 100 firm. Security and Zero Trust expansion also fueled growth, with Cloudflare winning major contracts by displacing incumbents. Pool of funds contracts contributed significantly, comprising about 9% of Q4 revenue. The company remains bullish on AI efficiency, highlighting its ability to optimize GPU utilization to 70%, well above industry averages. FedRAMP High certification further strengthens NET’s government business. NET results topped estimates, and the stock surged 17.8% on 2/7…
Continue reading our Conference Call Recap for NET by becoming a Bespoke Institutional subscriber. You can sign up for Bespoke Institutional now and receive a 14-day trial to read our newest Conference Call Recap. To sign up, choose either the monthly or annual checkout link below:
Q4 2024 Earnings Conference Call Recaps: Amazon.com (AMZN)
Bespoke’s Conference Call Recaps use AI to summarize lengthy earnings calls. The commentary below is AI-generated and then edited by Bespoke for quality control. As always, none of these summaries should be construed as recommendations to buy or sell any securities, and investors should do their own research and/or consult with a financial professional before making any investment decisions.
Our latest recap available to Bespoke subscribers covers Amazon.com’s (AMZN) Q4 2024 earnings call.
![]()
Amazon.com (AMZN) is the world’s largest e-commerce company and a dominant force in cloud computing through AWS. It sells everything from everyday essentials to high-end electronics, with a growing focus on faster delivery, AI-driven personalization, and advertising. AWS powers much of the internet’s infrastructure, and Amazon’s AI and machine learning innovations shape how businesses and consumers interact with technology. AMZN reported $187.8 billion in revenue (+10% YoY), driven by AWS growth, improved fulfillment, and a strong holiday shopping season. AWS, now a $115 billion annualized business, is working on advancing its AI infrastructure with Trainium2 chips and partnerships like Anthropic’s Project Rainier. Prime’s same-day delivery network grew 60% in 2024, great for strengthening demand for everyday essentials. Advertising revenue hit $17.3 billion (+18% YoY), now a $69 billion annual business. Cost-cutting efforts improved logistics, lowering fulfillment expenses while boosting speed. Despite macro concerns like currency headwinds and AI supply constraints, AMZN is aggressively investing in AI, automation, and robotics to drive future growth. On better-than-expected results, AMZN fell 4.1% given weaker guidance…
Continue reading our Conference Call Recap for AMZN by becoming a Bespoke Institutional subscriber. You can sign up for Bespoke Institutional now and receive a 14-day trial to read our newest Conference Call Recap. To sign up, choose either the monthly or annual checkout link below:
Q4 2024 Earnings Conference Call Recaps: Eli Lilly (LLY)
Bespoke’s Conference Call Recaps use AI to summarize lengthy earnings calls. The commentary below is AI-generated and then edited by Bespoke for quality control. As always, none of these summaries should be construed as recommendations to buy or sell any securities, and investors should do their own research and/or consult with a financial professional before making any investment decisions.
Our latest recap available to Bespoke subscribers covers Eli Lilly’s (LLY) Q4 2024 earnings call.
![]()
Eli Lilly (LLY) is a pharmaceutical giant specializing in treatments for diabetes, obesity, oncology, neuroscience, and immunology. LLY is best known for Mounjaro and Zepbound, its blockbuster incretin drugs driving the weight-loss and diabetes markets. The company also develops cutting-edge Alzheimer’s treatments, including Kisunla (donanemab), and invests heavily in oncology and cardiometabolic advancements. In Q4, LLY delivered 45% revenue growth, driven by Mounjaro ($3.5B) and Zepbound ($1.9B), with Zepbound now the market leader in anti-obesity drugs. The company is expanding production 1.6x in early 2025 to ease supply constraints. Regulatory wins include confirmation that Zepbound’s use for obstructive sleep apnea approval could enable Medicare reimbursement, broadening access. International sales surged, with 82% growth in Europe and a China launch underway. The pipeline remains strong, with Orforglipron’s oral GLP-1 readouts expected in 2025, and new oncology and Alzheimer’s trials progressing. Despite lawsuits over compounded GLP-1s, LLY is confident demand remains strong and sees a long runway for growth in obesity, diabetes, and cardiometabolic health. After beating estimates, LLY’s stock was up 3.3% on 2/6…
Continue reading our Conference Call Recap for LLY by becoming a Bespoke Institutional subscriber. You can sign up for Bespoke Institutional now and receive a 14-day trial to read our newest Conference Call Recap. To sign up, choose either the monthly or annual checkout link below:
Small Business Sentiment Wild Ride
This morning was light for economic data with the only release of note being the NFIB’s Small Business Optimism index. The headline number was expected to pull back following the post election surge, but the decline was larger than expected as it came in at 102.8 versus forecasts of 104.7. That being said, as shown in the chart below, small business sentiment is still up huge since last November’s election.

In the table below, we show the readings across the report’s sub-indices for January and December, the month over month change, and how those all rank as a percentile of all periods. As shown, the Optimism Index’s decline in January was actually quite large falling in the bottom decile of all months’ moves. Playing into that were bottom decile declines in a number of inputs like: inventory plans, expected credit conditions, viewing now as a good time to expand, and capital outlay plans. For that last category, the 7-point drop was actually a record single month decline. That is also only one indicator of a number that point to softening capex and labor market conditions which we discussed in today’s Morning Lineup.
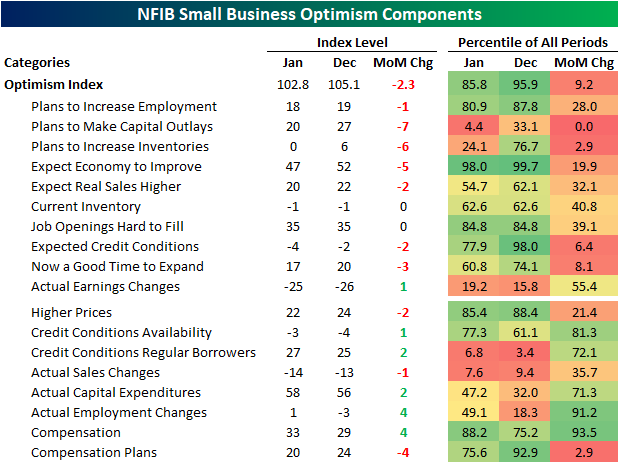
As shown in the table above, breadth in January was weak on the whole. For all categories (both inputs and non-inputs for the headline index), there were ten indices that fell month over month versus six that rose while another two were unchanged. Looking at the decliners, most of the categories are expectation or plans based. Contrary to that weakness in soft data, hard data indices like actual earnings and employment changes were generally the ones that improved versus December.
In the charts below, we create indices tracking the strength of hard and soft data categories in the report. Following the election, the soft data index soared as expectations and optimism massively improved given small business sentiment has a tendency to favor Republicans. The historically strong readings in that index left more muted hard data in the dust. With that said, January saw the soft data index revert lower although it is still at solid levels in the 63rd percentile of readings. Meanwhile, hard data has continued to improve and is now at the highest level since September 2023.

Again, although the January report showed some moderation in small business optimism, reporting firms are still extremely optimistic. For example, the index of Outlook for General Business Conditions pulled back but remains in the top 2% of readings in the survey’s history. Likewise, the share of respondents reporting now as a good time to expand is around some of the highest levels of the past few years.

The NFIB offers a breakdown of reasons given for expansion outlooks. As shown in the second chart below, the strength in positive expansion outlooks has been largely driven by politics. Similarly, those giving uncertain outlooks have less frequently been pointing the finger at politics, however, there was an identical share in January that said costs of expansion was the reason for uncertainty. Unchanged at 7%, that was the highest reading since February 2020. Perhaps most notably, for those reporting an uncertain outlook, a record 22% share blamed economic conditions.

As much as a shifting political landscape has benefitted small business optimism, January did also see an interesting spike higher in the percentage of businesses reporting taxes and government red tape as their biggest issues as the threat of tariffs were quickly introduced. That reading rose to 27% of responses which was the highest since November 2021.

One other indication that Trump’s tariff plans have caused some trepidation among small businesses is the Economic Policy Uncertainty index. As shown below, during election years it is normal for this index to rise sharply. This most recent election was a prime example with the largest election year jump to date. While things moderated significantly in the wake of the election with a 24 point decline from the October report through December (also a record for all prior election years), the most recent reading for January showed a 14 point month over month rebound. Not only is that the largest jump of any inauguration month, but it is also the largest month over month increase in the index’s history.


Chart of the Day – Sentiment Takes a Hit
Bespoke’s Morning Lineup – 2/11/25 – Powell Heads to the Hill
See what’s driving market performance around the world in today’s Morning Lineup. Bespoke’s Morning Lineup is the best way to start your trading day. Read it now by starting a two-week trial to Bespoke Premium. CLICK HERE to learn more and start your trial.
“Common sense is the most widely shared commodity in the world, for every man is convinced that he is well supplied with it.” – René Descartes

Below is a snippet of commentary from today’s Morning Lineup. Start a two-week trial to Bespoke Premium to view the full report.
Equity futures are moderately lower this morning with technology leading the way to the downside as markets digest the latest round of tariffs from the President last night. Treasury yields and crude oil are higher, and the only economic report of the day – the NFIB Small Business Optimism survey showed a modest deterioration after the historic post-election surge.
As you probably know by now, this is an important week for interest rates. It starts with today’s Senate testimony by Fed Chair Powell. Then, we’ll get CPI and more Powell testimony at the House tomorrow. Thursday will cap things off with PPI, but there will also be plenty of other Fedspeak sprinkled in between. Maybe all this Fed/inflation news will allow the market to shift some of its attention from the White House!
Heading into today’s Powell testimony, Treasury yields are at an important juncture. The 10-year yield saw a sharp decline from its mid-January peak of 4.8% down below 4.4% but increased in the last few days moving back above 4.5% this morning. As shown in the chart, these levels put the 10-year yield back above its 50-day moving average (DMA) but still below the uptrend line that was broken to the downside last week. It’s common to see a test of a former trend line after it has been broken, and how that test turns out in the short term can often signal the intermediate-term direction going forward. An upside break would potentially signal higher rates going forward while a failed test could indicate a longer downtrend in rate from here.

Chart of the Day: The Biggest Losers
The Closer – Inflation Expectations, Mortgages, Auctions – 2/10/25
Log-in here if you’re a member with access to the Closer.
Looking for deeper insight into markets? In tonight’s Closer sent to Bespoke Institutional clients, we lead off with a look at the latest inflation expectation data (page 1) followed by a review of the other data featured in the New York Fed’s Survey of Consumer Expectations (page 2). Afterward, we check in on mortgage rates and earnings (page 3) and then preview this week’s Treasury issuance (page 4). We then close with a weekly recap of positioning data (pages 5 -8).

See today’s full post-market Closer and everything else Bespoke publishes by starting a 14-day trial to Bespoke Institutional today!
Q4 2024 Earnings Conference Call Recaps: Illinois Tool Works (ITW)
Bespoke’s Conference Call Recaps use AI to summarize lengthy earnings calls. The commentary below is AI-generated and then edited by Bespoke for quality control. As always, none of these summaries should be construed as recommendations to buy or sell any securities, and investors should do their own research and/or consult with a financial professional before making any investment decisions.
Our latest recap available to Bespoke subscribers covers Illinois Tool Works’ (ITW) Q4 2024 earnings call.
![]()
Illinois Tool Works (ITW) is an industrial manufacturer operating across seven business segments, producing specialized components, equipment, and consumables for automakers, construction firms, semiconductor manufacturers, food service providers, and others. The company’s performance offers insights into industrial demand, global manufacturing trends, and capital spending across key markets. ITW closed its year out with record margins and free cash flow despite macro uncertainty. Automotive OEM outperformed industry builds, especially in China, where ITW gained market share in EVs. Semiconductor and electronics markets showed early signs of recovery, while construction remained soft due to weak housing starts. Food equipment saw strong service demand (+5%). ITW remains cautious on 2025 demand, forecasting 1-3% organic growth, but expects another 100 bps of margin expansion. Tariffs remain a watch item, but ITW is confident in its pricing power. ITW shares were flat on 2/5 after posting mixed results…
Continue reading our Conference Call Recap for ITW by becoming a Bespoke Institutional subscriber. You can sign up for Bespoke Institutional now and receive a 14-day trial to read our newest Conference Call Recap. To sign up, choose either the monthly or annual checkout link below:
Q4 2024 Earnings Conference Call Recaps: Yum! Brands (YUM)
Bespoke’s Conference Call Recaps use AI to summarize lengthy earnings calls. The commentary below is AI-generated and then edited by Bespoke for quality control. As always, none of these summaries should be construed as recommendations to buy or sell any securities, and investors should do their own research and/or consult with a financial professional before making any investment decisions.
Our latest recap available to Bespoke subscribers covers Yum! Brands’ (YUM) Q4 2024 earnings call.
![]()
Yum! Brands (YUM) is one of the world’s largest restaurant companies, owning iconic fast-food chains KFC, Taco Bell, Pizza Hut, and Habit Burger. With over 60,000 locations in 155 countries, the company operates a heavily franchised model. Digitally, YUM is a leader within the quick-service industry, with over 50% of system sales now coming through digital channels. In Q4, YUM delivered 5% system sales growth, despite headwinds in some international markets. Taco Bell US led the way, with 6% full-year system sales growth and strong consumer engagement, including the successful $7 Luxe Box and Decades platform. KFC International rebounded, with sales in the Middle East up 11% in Q4 after a tough year, while Africa and Latin America posted mid-to-high single-digit growth. Pizza Hut struggled in the US but improved internationally, with new digital-focused store concepts rolling out. YUM also introduced Bite by Yum!, a proprietary tech suite aimed at accelerating AI-driven personalization and digital sales, which grew 15% in 2024. After beating estimates, YUM shares climbed 9.7% on 2/6…
Continue reading our Conference Call Recap for YUM by becoming a Bespoke Institutional subscriber. You can sign up for Bespoke Institutional now and receive a 14-day trial to read our newest Conference Call Recap. To sign up, choose either the monthly or annual checkout link below: