Bespoke’s Morning Lineup – 3/20/25 – Higher Lows
See what’s driving market performance around the world in today’s Morning Lineup. Bespoke’s Morning Lineup is the best way to start your trading day. Read it now by starting a two-week trial to Bespoke Premium. CLICK HERE to learn more and start your trial.
“What’s your hurry? Because now is the only time there ever is to do a thing in.” – Uncle Tom’s Cabin, Harriet Beecher Stowe

Below is a snippet of commentary from today’s Morning Lineup. Start a two-week trial to Bespoke Premium to view the full report.
From the FOMC’s interest rate announcement through the end of Chair Powell’s press conference, the S&P 500 steadily rallied higher. Almost exactly when Powell stopped speaking, though, stocks started to weaken, and they closed well off the intraday highs. The post-presser weakness has continued this morning as S&P 500 futures are down about 35 bps while the Nasdaq is down half a percent. There’s not much in the way of a catalyst to point to for this morning’s weakness, but overnight Asia was lower, and European stocks are also in the red. ECB President Lagarde commented that 25% tariffs on US imports of European goods would knock 0.3 percentage points from Eurozone economic growth in the first year of their implementation while an escalation would only exacerbate those impacts.
There are several economic reports on the calendar this morning, including jobless claims and the Philly Fed report at 8:30 followed by Leading Indicators and Existing Home Sales at 10 AM. On the sentiment front, the weekly survey from AAII showed that bearish sentiment came in at 58.1%. That marks the fourth straight week of readings above 55% which has never happened in the survey’s history (since 1987), and it’s only the seventh time that bearish sentiment has been above 50% for four or more straight weeks.
It’s not often that you get a setup where just about all of the major US indices rally more than 1% over the last week and yet every single one remains in oversold territory. After the plunge in stocks during the first two weeks of March took all the major index ETFs into ‘extreme’ oversold territory as of last week, the rally we have seen since last Thursday’s close has only been enough to move them merely into oversold territory, and based on where futures are trading now, they’re on pace to remain oversold today.

The last four trading days were a welcome respite from the barrage of selling, and it was the first time since the February peak that the S&P 500 traded higher three times in a four-trading day span. With that pause in the selling, the S&P 500 is looking to find some semblance of stabilization from what has practically been a straight down leg lower. Stabilization doesn’t mean immediately reversing and trading in a straight line higher. Usually, it takes a period of back-and-forth churning before the market can gain enough energy to stage a rally. Looking at the chart, bulls hope that is exactly what the S&P 500 is doing now, but only time will tell.
With such a steep drop lower in the last month, it’s hard to remember that the S&P 500 had another leg lower from late 2024 and into early 2025 when the S&P 500 pulled back just over 4%. Back then, it seemed like a meaningful pullback, but not so much now.

Bespoke Baskets Update — March 2025
The Closer – FOMC, Transports Death Cross, TICS – 3/19/25
Log-in here if you’re a member with access to the Closer.
Looking for deeper insight into markets? In tonight’s Closer sent to Bespoke Institutional clients, we start out with a look at the changes to the SEP and other news out of the FOMC meeting (pages 1 and 2). We then look at the Dow Transport’s death cross (page 3) before closing out with a look at the latest TIC flows and gold reserves (page 4).
See today’s full post-market Closer and everything else Bespoke publishes by starting a 14-day trial to Bespoke Institutional today!
Q4 2024 Earnings Conference Call Recaps: Williams-Sonoma (WSM)
Bespoke’s Conference Call Recaps use AI to summarize lengthy earnings calls. The commentary below is AI-generated and then edited by Bespoke for quality control. As always, none of these summaries should be construed as recommendations to buy or sell any securities, and investors should do their own research and/or consult with a financial professional before making any investment decisions.
Our latest recap available to Bespoke subscribers covers Williams-Sonoma’s (WSM) Q4 2024 earnings call.
![]()
Williams-Sonoma (WSM) is a high-end home retailer specializing in furniture, kitchenware, and décor through brands like Pottery Barn, West Elm, and its namesake Williams-Sonoma. The company designs and sources much of its inventory in-house, giving it a competitive edge in pricing and product differentiation. Serving both individual consumers and businesses, WSM provides a window into home furnishing demand, consumer spending trends, and supply chain dynamics. WSM delivered a positive 3.1% comp in Q4, outperforming an industry decline of 2%, despite no housing market improvement. Non-furniture categories like seasonal decor and housewares drove demand, while furniture sales rebounded due to new collections and improved inventory levels. AI-powered marketing and supply chain efficiencies are reducing costs, with further savings expected from WSM’s Arizona distribution center in 2025. B2B sales hit $1 billion, growing 10% with major hospitality and multifamily contracts. Tariffs are a headwind, but WSM is shifting sourcing, raising select prices, and expanding US manufacturing to offset costs. Despite posting better-than-expected results, WSM shares fell as much as 12.7% on Wednesday morning…
Continue reading our Conference Call Recap for WSM by becoming a Bespoke Institutional subscriber. You can sign up for Bespoke Institutional now and receive a 14-day trial to read our newest Conference Call Recap. To sign up, choose either the monthly or annual checkout link below:
The Lag 7
Stocks are higher today ahead of the FOMC’s interest rate announcement, Summary of Economic Projections (SEP), and the Powell press conference. Gains are good, but the S&P 500 is still down 8.1% from its 52-week high in February. While a decline of 8% sounds relatively modest, individual stocks in the index, especially the ten largest, have seen much larger declines. The chart below shows how far each of the ten largest stocks in the S&P 500 were trading from their closing 52-week high as of this morning. Of the ten, nine have seen pullbacks of at least 10%, and six of those have shed a fifth of their value. That’s a bear market! The only stock bucking the trend has been Berkshire Hathaway (BRK/b), which was trading at 52-week highs this morning. When stocks representing more than a third of the entire S&P 500 are down a median of more than 20% from their respective 52-week highs, you can understand why some investors have been feeling more pain in their portfolios than the decline in the S&P 500 would suggest.

Of the ten largest stocks in the S&P 500, most still have rising 200-day moving averages (DMA), which would suggest their longer-term uptrends remain intact. The two exceptions are Microsoft (MSFT) and Alphabet (GOOGL). Both stocks have just recently seen their 200-DMA peak and start to roll over in the last few weeks.


Along with MSFT and GOOGL, Nvidia (NVDA) and Tesla (TSLA) are two stocks among the top ten where the 200-DMA is still rising, but it’s coming really close to rolling over. Unless these stocks see a pretty big bounce in the days and weeks ahead, a rollover in their respective 200-DMAs is inevitable. That doesn’t mean the stocks will continue to decline, but if the 200-DMA tends to act as resistance and it’s also falling in the process, it doesn’t present a good technical setup.


Chart of the Day – Vol & Stocks Drop
Bespoke’s Morning Lineup – 3/19/25 – More Uncertainty
See what’s driving market performance around the world in today’s Morning Lineup. Bespoke’s Morning Lineup is the best way to start your trading day. Read it now by starting a two-week trial to Bespoke Premium. CLICK HERE to learn more and start your trial.
“The world keeps ending but new people too dumb to know it keep showing up as if the fun’s just started.” – John Updike
Below is a snippet of commentary from today’s Morning Lineup. Start a two-week trial to Bespoke Premium to view the full report.
To view last night’s CNBC segment which covered Nvidia’s (NVDA) AI conference and the broader market weakness, click on the image below.

As investors wait on the FOMC’s interest rate decision (or lack thereof), the Summary of Economic Projections (SEP), and the press conference from Chair Powell, US equity futures have a modestly positive bias heading into the opening bell.
Besides the FOMC, there are no major economic or earnings-related reports on the calendar, but one newsworthy item just coming across the tape is comments from Bank of America (BAC) CEO Brian Moynihan saying that as of Monday, consumers have put 6% more dollars into the economy this year than they did over the same period last year. Wait. What? Haven’t these recent consumer sentiment surveys been suggestive of the consumer falling off a cliff? As Moynihan commented, “the economy is holding up better than people think”.
Uncertainty is everywhere you look as any index that attempts to measure it has surged in the last couple of months. Within today’s FOMC statement and SEP, we’re likely to see more of that. The Fed releases its SEP four times a year, and in the last release back in December we started to see some of that.
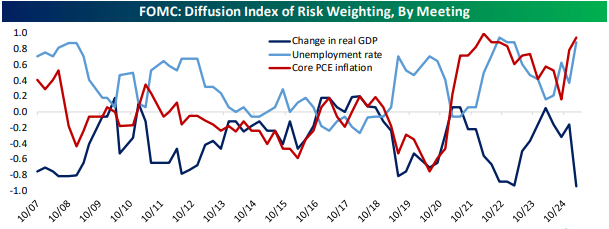
In addition to updating their forecasts for GDP Growth, the Unemployment Rate, Inflation, and the expected level of the Fed Funds rate in the coming years, in each SEP, members of the FOMC also note their level of uncertainty about each of their forecasts along with whether the risks to their projections are weighted to the upside, downside, or not at all.
Back in December, FOMC members noted big increases in the level of uncertainty about PCE inflation on both a headline and core basis and almost unanimously agreed that the risks to inflation were to the upside. That was a big shift to September when most participants thought inflation risks were ‘broadly balanced’. Since those projections back in December, the country’s tariff policy has only grown murkier, so don’t expect any improvement in these readings today.

Back in December, levels of uncertainty regarding GDP Growth and the Unemployment Rate weren’t nearly as high. For most members of the FOMC, risks to GDP growth and the Unemployment Rate were ‘broadly balanced’. However, given the plunging levels of sentiment in various measures of consumer and business confidence plus the rapidly declining levels of forecasted growth in models like the Atlanta Fed GDP Now, it’s hard to imagine that FOMC members are any more confident about expected economic growth and the state of the jobs market going forward.

The Closer – Retail Bear, Canada CPI, IP Sensitivity – 3/18/25
Log-in here if you’re a member with access to the Closer.
Looking for deeper insight into markets? In tonight’s Closer sent to Bespoke Institutional clients, we begin with a look at the bear market sized drawdown in Amazon (AMZN) and what that means for the broader market and economy (page 1). We then review today’s inflation print North of the border (page 2) followed by a review of the latest industrial production data (page 3) and the stocks that have been most sensitive to that release (page 4). We then close out with a review of the New York Fed services data (page 5).

See today’s full post-market Closer and everything else Bespoke publishes by starting a 14-day trial to Bespoke Institutional today!
Chart of the Day – Back to Back Strong Breadth Days
Bespoke’s Morning Lineup – 3/18/25 – Three-peat?
See what’s driving market performance around the world in today’s Morning Lineup. Bespoke’s Morning Lineup is the best way to start your trading day. Read it now by starting a two-week trial to Bespoke Premium. CLICK HERE to learn more and start your trial.
“Though the people support the government; the government should not support the people.” – Grover Cleveland
Below is a snippet of commentary from today’s Morning Lineup. Start a two-week trial to Bespoke Premium to view the full report.
Futures are modestly lower this morning, but since the S&P 500 is coming off its first back-to-back positive days since the February peak, bulls can’t get greedy – although a three-peat would be nice! In that two-day rally, the S&P 500 gained 2.8% for its best two-day gain since the days after the election. That was when the markets had a much more optimistic view of what Trump 2.0 would mean for stock prices. Ironically, the S&P 500 closed the day before Election Day 2024 at 5,712, and yesterday it closed at 5,675, so the market has essentially gone nowhere despite all the highs and lows during the last 4.5 months.
The chart below shows the S&P 500’s performance during the current bull market that began in October 2022 with red dots showing each two-day gain of over 2.5%. Early in the bull market, these types of moves were common, but their frequency over the last 18 months has been much less common.
