Bespoke’s Morning Lineup – 5/18/26 – Lucky Seven?
See what’s driving market performance around the world in today’s Morning Lineup. Bespoke’s Morning Lineup is the best way to start your trading day. Read it now by starting a two-week trial to Bespoke Premium. CLICK HERE to learn more and start your trial.
“The future starts today, not tomorrow.” – Pope John Paul II

Below is a snippet of commentary from today’s Morning Lineup. Start a two-week trial to Bespoke Premium to view the full report.
Last week’s Trump-Xi summit, which failed to produce any meaningful results, coupled with data suggesting inflationary pressures in the economy, has left stocks facing an uphill battle. That pressure has continued into the new week. S&P 500 futures were firmly lower but have rebounded on reports from Iran that the US will offer a temporary waiver on Iranian oil sanctions. Both the S&P 500 and Nasdaq were indicated to gap down by about 0.5% at the open, but are now just modestly negative, while the 10-year yield is fractionally lower. Crude oil prices are modestly higher, and gold and Bitcoin are lower, with the latter trading back down below 77K.
In Asia, it was a mixed session with Japan and Hong Kong both down 1% while South Korea had a fractional gain of 0.3%. Economic data in China disappointed with April Retail Sales rising just 0.2% while Industrial Production missed forecasts by close to two full percentage points (4.1% vs 6.0%).
In Europe, the STOXX 600 is down 0.4% with Italy down close to 2% after reporting a smaller-than-expected March trade surplus. The UK is trading 0.3% higher as reports suggest PM Starmer is planning to step down.
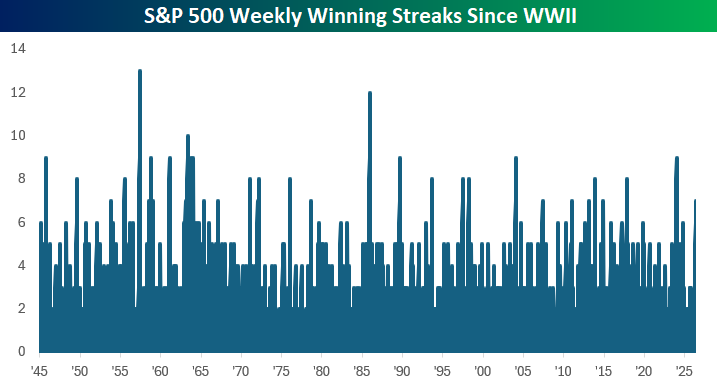
Last week ended on a down note with the S&P 500 declining through the last two hours of the trading session to finish down near the lows of the day. It was a close call at the end of the day on Friday, but the S&P 500 managed to clock its seventh straight week of gains. That’s the longest winning streak since a 9-week streak of gains in December 2023 and the 34th streak of at least seven weeks since WWII.
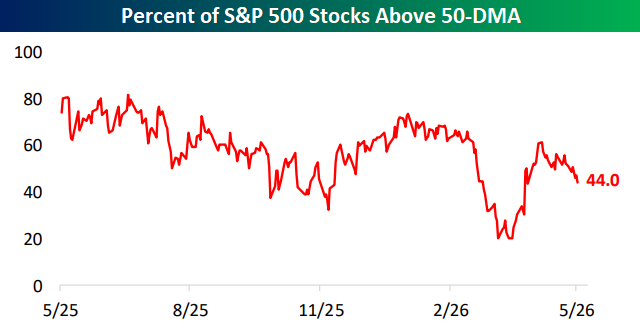
While the S&P 500 may have finished last week higher, breadth remains weak. As of Friday’s close, just 44% of stocks in the S&P 500 were trading above their 50-day moving average, which is hardly the type of reading you would expect to see with a market right near record highs. After a sharp rebound off the April lows, the percentage of stocks above their 50-DMA has been steadily declining for a few weeks now, even as the index has continued higher.
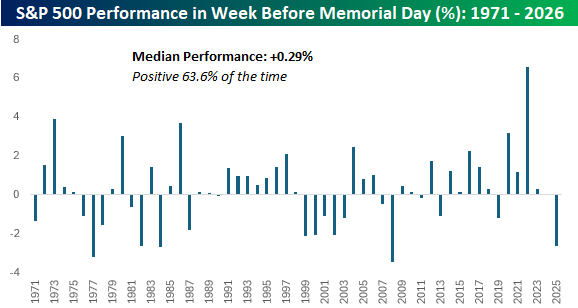
It doesn’t officially start for another month, but the unofficial start to summer kicks off this weekend, just after the unofficial end to earnings season on Thursday, when Walmart (WMT) reports. In the week leading up to the summer season, stocks have tended to have a modestly positive return. Since 1971, when the last Monday of May became the official observance of Memorial Day, the S&P 500’s median performance during the week was a gain of 0.29% with positive returns just under two-thirds of the time. That said, last year’s decline of 2.6% leading up to Memorial Day weekend was the worst pre-holiday performance for the S&P 500 since 2007, and the fifth worst since 1971. Who wants a hot dog with their burger!
Start a two-week trial to Bespoke Premium to continue reading today’s full Morning Lineup.
Brunch Reads – 5/17/26
Welcome to Bespoke Brunch Reads — a linkfest of some of our favorite articles over the past week. The links are mostly market-related, but there are some other interesting subjects covered as well. We hope you enjoy the food for thought as a supplement to the research we provide you during the week.
Brown v. Board of Ed: On May 17, 1954, the United States Supreme Court handed down one of the most important decisions in American history: Brown v. Board of Education. In a unanimous ruling written by Chief Justice Earl Warren, the Court declared that racial segregation in public schools violated the Equal Protection Clause of the 14th Amendment, overturning decades of legal precedent and striking at the foundation of Jim Crow America.
Since the late 1800s, segregation had been protected by the Supreme Court’s decision in Plessy v. Ferguson, which established the doctrine of “separate but equal.” In reality, Black Americans across the South, and in many parts of the North, were forced into schools, transportation systems, neighborhoods, and public facilities that were dramatically inferior to those used by white Americans.
The Brown case began in Topeka, where a Black third-grade student named Linda Brown was denied admission to a white elementary school located close to her home. Instead, she had to travel farther to attend an all-Black school. Her father, Oliver Brown, joined with other families in a lawsuit against the local Board of Education. The case became part of a broader legal campaign led by the NAACP and attorneys, including Thurgood Marshall, who argued that segregation itself created inequality, regardless of whether school facilities appeared similar on paper.
Civil rights advocates celebrated the decision as a monumental victory and a moral turning point for the nation. In much of the South, however, political leaders vowed resistance. Some states closed public schools rather than integrate them, while others delayed compliance for years. The Court’s follow-up ruling in 1955, often called Brown II, ordered desegregation to proceed “with all deliberate speed.” Brown would then become a cornerstone of the modern Civil Rights Movement. It helped inspire activism that would lead to events like the Montgomery Bus Boycott, the March on Washington, and eventually landmark legislation such as the Civil Rights Act of 1964 and the Voting Rights Act of 1965.

Economic Trends
The Postpandemic U.S. Immigration Surge: New Facts and Inflationary Implications (NBER)
The recent immigration surge added a large number of lower-skilled workers to the US economy, many of whom tend to spend most of what they earn rather than save it. While that boosted consumer demand, it also expanded the labor supply enough to offset much of the inflationary pressure, leaving overall inflation little changed according to the model. [Link]
Continue reading our weekly Brunch Reads linkfest by logging in if you’re already a member or signing up for a trial to one of our two membership levels shown below! You can cancel at any time.

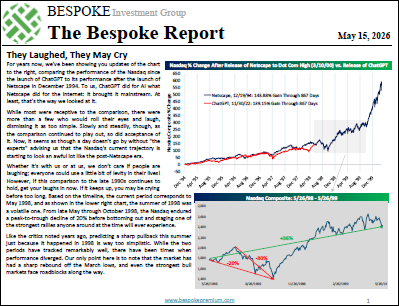
The Bespoke Report – 5/15/26 – The Laughed, They May Cry
The S&P has continued to leg higher in a picture-perfect breakout that now looks less like a “V” and more like a checkmark.
The market continues to follow the post-Netscape pattern, and more and more investors are starting to embrace the comparison. Is now the wrong time to be rooting for that comparison?
We cover everything going on across markets and the economy in this week’s Bespoke Report newsletter.
To read this week’s newsletter and gain access to the rest of Bespoke’s daily research, start a 30-day trial to one of our three unique membership levels. CLICK HERE to sign up today!

Nasdaq Gets Extended
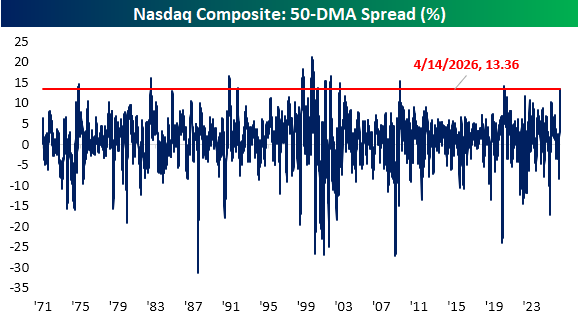
The sharp rally off of the March 30th low has seen the Nasdaq climb 25.9%. Back at the time of the low, the Nasdaq was extremely oversold, trading 2.85 standard deviations below its 50-DMA. In percentage terms, the Nasdaq was down 8.4% below that same moving average, which was a lot, but far from any sort of record setting reading.
Fast forward to yesterday’s close, the opposite was true. While the index wasn’t even extremely overbought (only 1.9 standard deviations above its 50-DMA), it did finish 13.4% above its 50-DMA for the most extended reading since June 2020. Going back throughout the over 50 years of history of the index, such extreme readings in the 50-DMA spread have been uncommon. Prior to the 2020 instance, the only other times it traded as far above its moving average was in 2009, various points in the 1990s to the Dot Com bubble burst in the early 2000s, 1982, and 1975.
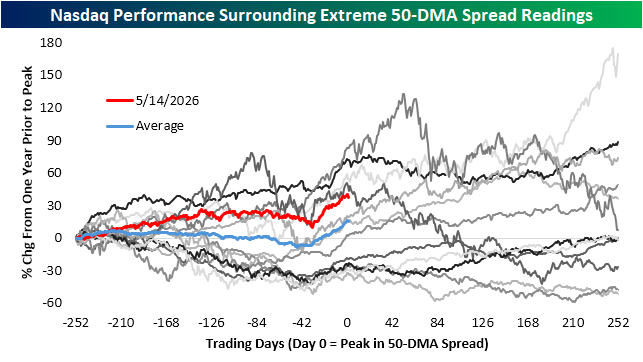
In the chart below, we show how the Nasdaq performed in the one year before and after those historic peaks in the 50-DMA spread. For each line below, day 0 indicates the peak reading in the 50-DMA spread. As shown, of the dozen previous periods, the Nasdaq has been higher versus one year prior seven of the times. This latest rally ranks as the fifth largest of those at 40%. Only the 1992, 1999, and 2000 instances saw bigger gains. Of those periods with larger gains, the following year only saw the index higher twice (up 9.5% after the 1992 instance and 75% after the January 1999 instance) whereas the others were more immediately leading up to the early 2000 Dot Com peak.
Like this analysis? Join our premium members by starting a trial today! Click below for details on how to sign up:

S&P 500 is Still Overbought
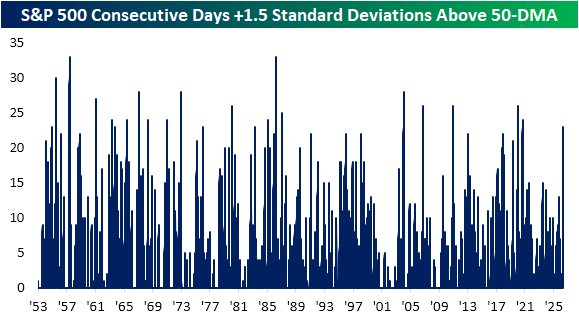
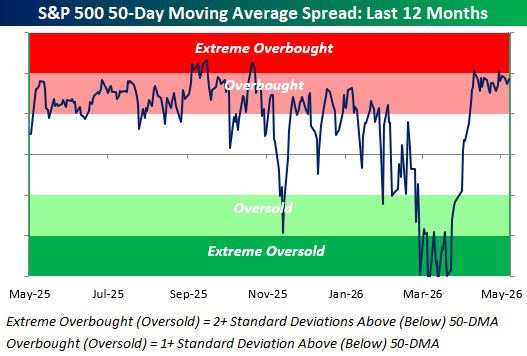
Although the index is lower to round out the week, the S&P 500 repeatedly reached more record highs recently. With the rally largely unabated, the index has been in overbought territory (> one standard deviation above its 50-DMA) every single session since April 14th. Not only has the S&P been overbought, but firmly so. Of the 24 consecutive sessions in overbought territory, the past 23 have seen the index close at least 1.5 standard deviations above its 50-DMA.
As shown below, this is now the longest streak of firmly overbought readings (consecutive trading days with the index at least 1.5 standard deviations above its 50-DMA) since September 2020. Looking back to the start of the 5-day trading week in 1953, there have been a total of 22 other streaks of at least 23 days. The longest of these extended to 33 straight sessions in March 1983 and May 1967.
Like this analysis? Join our premium members by starting a trial today! Click below for details on how to sign up:
Striking Breadth Levels
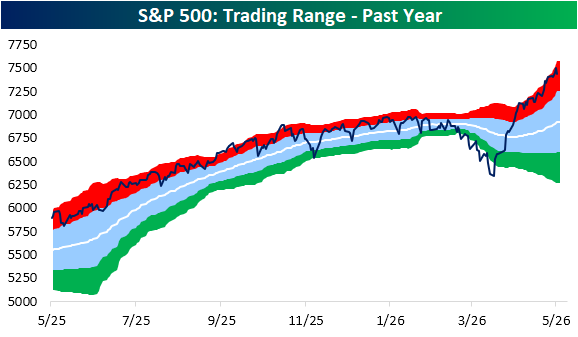
The S&P 500 has been driven higher by large-cap hyperscalers and semiconductors over the last month. This has pushed the index significantly above its 50-day moving average, indicating it’s well above trend right now.
As shown below, the index would need to fall 8% just to get back down to its 50-DMA from these levels!
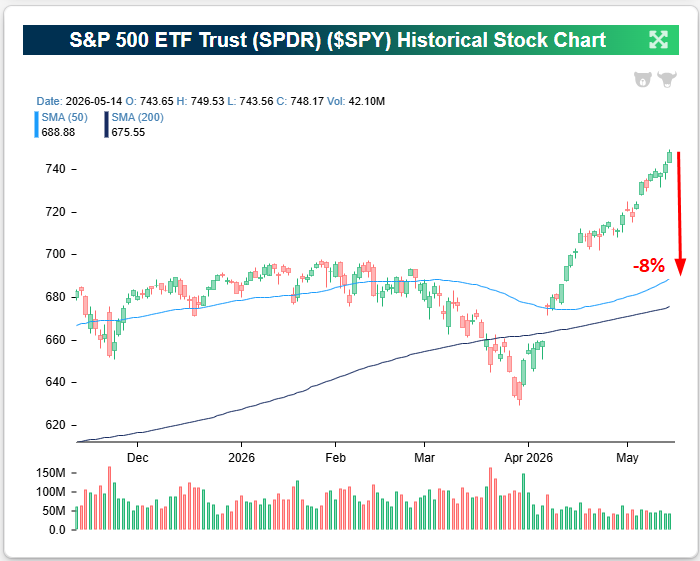
The S&P’s price has now been “overbought” (more than one standard deviation above its 50-DMA) for 23 straight trading days:
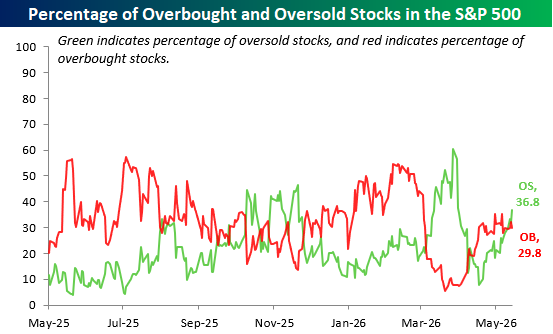
But while price is overbought, the underlying breadth in the index looks absolutely horrific.
With the S&P remaining at overbought levels for more than a month, one would expect a majority of stocks in the index to be overbought as well. In reality, though, more than a third (36.8%) of S&P 500 stocks are actually “oversold” (more than one standard deviation below the 50-DMA), while just 29.8% are overbought.
The fact that so many more stocks are oversold than overbought in the S&P, even with the index’s price elevated well above its 50-DMA, highlights the narrowness of the recent rally.
Passive index investors have benefited even with the narrowness, but active investors without exposure to the AI infrastructure stocks have had a rough go of it.
Want to read more in-depth market analysis from Bespoke? Join our Think BIG mailing list or Bespoke Premium by starting a trial today! Click below for details on how to sign up for Premium:
Bespoke’s Morning Lineup – 5/15/26 – Rough End to the Week
See what’s driving market performance around the world in today’s Morning Lineup. Bespoke’s Morning Lineup is the best way to start your trading day. Read it now by starting a two-week trial to Bespoke Premium. CLICK HERE to learn more and start your trial.
“I always like to look on the optimistic side of life, but I am realistic enough to know that life is a complex matter.” – Walt Disney
Below is a snippet of commentary from today’s Morning Lineup. Start a two-week trial to Bespoke Premium to view the full report.
It may be Friday, but investors are in no mood to celebrate as equity futures are sharply lower. The Nasdaq is leading the losses, declining 1.28% while the S&P 500 is poised to open down by just under 1% (-0.90%). Treasury yields continue to march higher as they have all week, and in the commodity space, WTI crude oil is spiking 3% to just under $104 per barrel while gold is down over 2.5%. Bitcoin is also lower, falling by just 1%.
The weakness in US futures follows a lousy night in Asia. The Nikkei fell 2%, China was down over 1%, and South Korea plunged over 6%. Following these declines, all of Asia’s major indices finished the week lower. Higher yields contributed to the negative tone, and in South Korea, a potential labor strike at Samsung pressured that stock.
Weakness in Asia worked its way into Europe, and stocks are likewise lower across the board with declines of more than 1%. Here again, the primary culprit is higher yields, although CPI in Italy rose less than expected.
Getting back to the US, there’s not much in the way of earnings reports this morning, but at 8:30, we’ll get the release of the May Empire Manufacturing report, followed by Industrial Production and Capacity Utilization at 9:15.
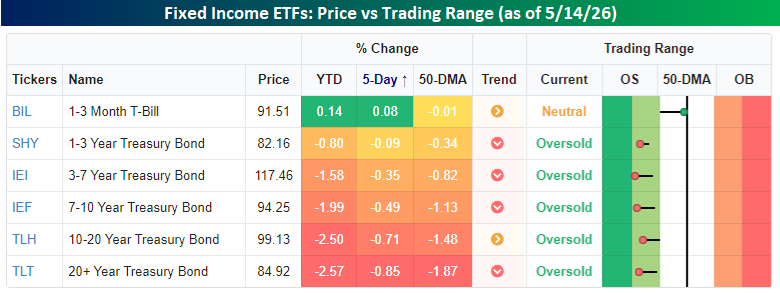
With inflation headlining the week’s economic data, and much of it surprising to the upside, yields have been an unavoidable and uncomfortable focus for investors. Almost across the entire yield curve, we’ve seen yields move higher this week, pushing the prices of the underlying bonds lower.
The snapshot of Treasury ETFs across the yield curve shows the story. Except for the shortest duration treasuries, prices have moved lower over the last five trading days (since last Thursday’s close), and the magnitude of the declines increases the further you go out on the curve. The magnitude of the declines hasn’t been extreme, but any treasury ETF with a duration of more than a year is currently oversold and will only get more oversold at the open today. YTD, it’s also been a year to forget, with declines nearly across the board.
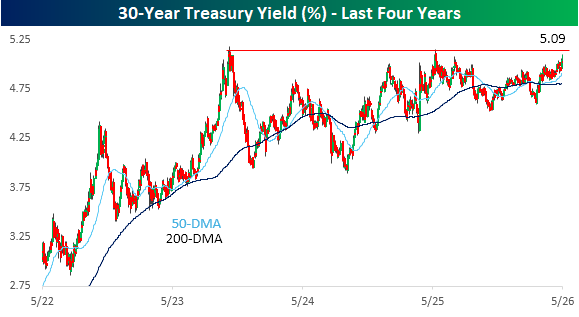
Of all the points on the yield curve, the 30-year is probably at the biggest crossroads. For nearly three years now, right above 5% has been a level the 30-year has flirted with multiple times, but each time it got there, the sellers didn’t have the firepower for a meaningful breakout. This week has been the third major test of that level as the yield pushes up towards 5.10% this morning. Will the third time be the charm or a strikeout?
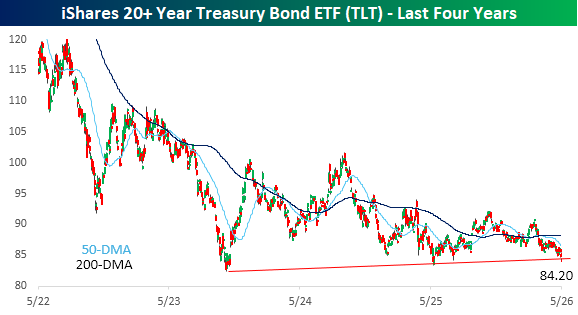
The iShares 20+ Year Treasury ETF (TLT) is the opposite of the 30-year yield. Prices plunged during 2022 and into early 2023 as the Fed hiked rates and inflation surged. As price pressures eased, yields and treasury prices stabilized, and while there was a rally off the 2023 lows into mid-2024, momentum quickly stalled out. Ever since then, prices have been stuck in the mid-80s, and this morning, TLT is trading down over 1% and testing support right around $84. It’s been a multi-year bear market for fixed income in the post-COVID era, and if these support levels don’t hold, the sector could be in store for a new leg lower.
Start a two-week trial to Bespoke Premium to continue reading today’s full Morning Lineup.
The Closer – New Highs and No Breadth, Freight, Trade Prices – 5/14/26
Log-in here if you’re a member with access to the Closer.
- The rebound in AI Doom stocks has broken over the past week while proxies for OpenAI have ripped higher.
- The past month has seen a historic consistency of new highs despite breadth hardly notching any new highs.
- Both import and export prices rose significantly more than expected in April data.
See today’s full post-market Closer and everything else Bespoke publishes by starting a 14-day trial to Bespoke Institutional today!
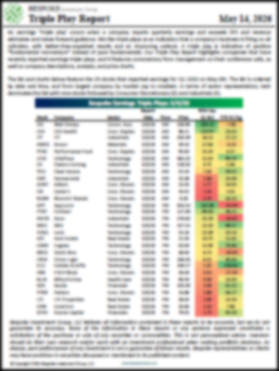
The Triple Play Report: 5/14/26
An earnings triple play is a stock that reports earnings and manages to 1) beat analyst EPS estimates, 2) beat analyst sales estimates, and 3) raise forward guidance. You can read more about “triple plays” at Investopedia.com where they’ve given Bespoke credit for popularizing the term. We like triple plays as an indication that a company’s business is firing on all cylinders, with better-than-expected results and an improving outlook. A triple play is indicative of positive “fundamental momentum” instead of pure fundamentals, and there are always plenty of names with both high and low valuations on our quarterly list.
Bespoke’s Triple Play Report covers what each company does, what this quarter’s results say about their growth outlooks, and their histories of delivering triple plays. Bespoke’s Triple Play Report is available at the Bespoke Institutional level only. You can sign up for Bespoke Institutional now and receive a 14-day trial to read today’s Triple Play Report. To sign up, choose either the monthly or annual checkout link below:
Bespoke Institutional – Monthly Payment Plan
Bespoke Institutional – Annual Payment Plan
Bespoke Investment Group, LLC believes all information contained in these reports to be accurate, but we do not guarantee its accuracy. None of the information in these reports or any opinions expressed constitutes a solicitation of the purchase or sale of any securities or commodities. This is not personalized advice. Investors should do their own research and/or work with an investment professional when making portfolio decisions. As always, past performance of any investment is not a guarantee of future results. Bespoke representatives or clients may have positions in securities discussed or mentioned in its published content.