The Closer – Uncertainty, Bond Bath, Housing – 5/22/25
Log-in here if you’re a member with access to the Closer.
Looking for deeper insight into markets? In tonight’s Closer sent to Bespoke Institutional clients, we begin with a look at the still elevated readings in policy uncertainty (page 1) followed by a look into the latest PMI readings (page 2). After a dive into existing home sales (page 3) and affordability (page 4), we review IPO issuance and performance (page 5). We finish with a rundown of week to date and today’s performance in relation to bond correlation (page 6).

See today’s full post-market Closer and everything else Bespoke publishes by starting a 14-day trial to Bespoke Institutional today!
Dividend Yields vs. Treasury Yields
While down a bit today, this week has seen a spike in long-term Treasury yields. Given the surge in yields, there has been a shake-up in the relationship between Treasury yields and dividend yields for stocks. As shown below, currently only 7.9% of stocks in the S&P 500 have dividend yields above the 10-year Treasury yield (4.59% at the time of writing). Additionally, only 12.1% of stocks in the index have dividend yields above that of the 2-year Treasury (4.0%).

Of course, yield dynamics are different for different sectors. As shown below, Real Estate has the highest percentage of stocks with dividend yields above the yield on the 10-year and 2-year. Energy, Utilities, and Materials are the sectors with the next largest shares, whereas cyclical groups like Tech, Industrials, and Consumer Discretionary hardly have any members with dividend yields larger than Treasury yields.

At the moment, there are 40 S&P 500 stocks with higher dividend yields than the 10-year yield, and we list them below. Two Materials stocks top the list with 9%+ dividend yields and over 20% declines on the year.

Like this post? Join our complimentary Dividend Discovery email newsletter to receive a dividend-centric post in your inbox a couple of times per week. If you’re interested in dividend stocks and ETFs, this newsletter is for you! CLICK HERE to sign up with just your email or click on the image below.

Chart of the Day – Filtering Out The Dregs
Bespoke’s Morning Lineup – 5/22/25 – Not the Breakout You Want to See
See what’s driving market performance around the world in today’s Morning Lineup. Bespoke’s Morning Lineup is the best way to start your trading day. Read it now by starting a two-week trial to Bespoke Premium. CLICK HERE to learn more and start your trial.
“The president wants lower rates… He and I are focused on the 10-year Treasury and what is the yield of that.” – Scott Bessent

Below is a snippet of commentary from today’s Morning Lineup. Start a two-week trial to Bespoke Premium to view the full report.
Equity futures have been weakening all morning as yields have risen. Oil prices are lower as OPEC+ mulls another production increase, and Bitcoin is above $111K. The House passed its tax bill, and we’re approaching a slew of economic data about to be released after what has to this point been a quiet week for data.
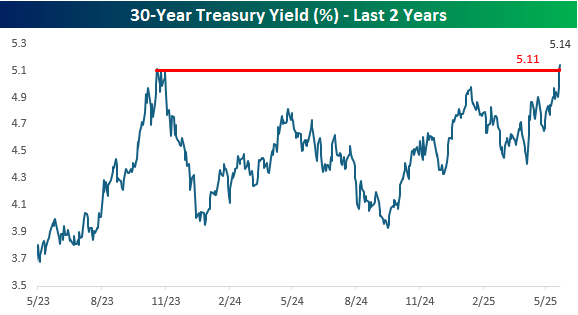
The President and Treasury Secretary may want and be focused on the level of yields, but that’s not what they’re getting. While the 10-year US Treasury yield still hasn’t reached a new high for the year, the 30-year yield broke out above resistance yesterday, trading as high as 5.11% and then adding to those gains this morning and reaching a yield of 5.14%. From a technical perspective, the move higher in yield looks like a textbook breakout, and if that pattern played out, it would suggest higher rates ahead.

From a longer-term perspective, 5.11% was an important level for the 30-year yield. Looking at a two-year chart, it represents the high from Q4 2023, and if current levels of 5.14% hold, we could be in for a new leg higher in yields, which would spell more headaches for equities.
The Closer – Aggressive Auction Losses, Retail Rebound – 5/21/25
Log-in here if you’re a member with access to the Closer.
Looking for deeper insight into markets? In tonight’s Closer sent to Bespoke Institutional clients, we start with a look at the historic reaction stocks had to today’s 20-year bond auction (page 1). We also show some other drivers of equity market performance (page 2) followed by a look into the big moves in retail stocks (page 3).

See today’s full post-market Closer and everything else Bespoke publishes by starting a 14-day trial to Bespoke Institutional today!
Bespoke Baskets Update — May 2025
Q1 2025 Earnings Conference Call Recaps: Toll Brothers (TOL)
Bespoke’s Conference Call Recaps use AI to summarize lengthy earnings calls. The commentary below is AI-generated and then edited by Bespoke for quality control. As always, none of these summaries should be construed as recommendations to buy or sell any securities, and investors should do their own research and/or consult with a financial professional before making any investment decisions.
Our latest recap available to Bespoke subscribers covers Toll Brothers’ (TOL) Q1 2025 earnings call.
![]()
Toll Brothers (TOL) is the nation’s leading builder of luxury homes, ranging from $300,000 to over $5 million across 24 states. The company specializes in architecturally distinctive, customizable homes and serves a financially strong clientele made up largely of move-up buyers, empty nesters, and affluent first-time homeowners. With its mix of build-to-order and spec homes (new homes built ready for purchase), TOL provides a unique lens into high-end housing demand, consumer confidence, and macro-driven buyer behavior. TOL delivered record Q2 home sales revenue of $2.71B on 2,899 homes. Spec home sales played a key role, with 1,000 completed specs and 2,400 in progress, though the company is slowing new spec starts to protect margins. Despite softer overall demand tied to declining consumer confidence and macro volatility, TOL reaffirmed full-year guidance, citing its resilient buyer base, 24% paid in cash, and financed buyers averaged 70% LTV (Loan-to-Value). Incentives rose modestly to 7% of ASP (Average Selling Price), and the company reiterated its strategy to prioritize price over pace in the current environment. The stock initially rose 6% after hours on 5/20 but declined into the red on 5/21…
Continue reading our Conference Call Recap for TOL by becoming a Bespoke Institutional subscriber. You can sign up for Bespoke Institutional now and receive a 14-day trial to read our newest Conference Call Recap. To sign up, choose either the monthly or annual checkout link below:
B.I.G. Tips – Death by Amazon – 5/21/25
In this note we update performance of our “Death By Amazon” and “Amazon Survivors” indices. Our “Death By Amazon” index has underperformed pretty dramatically since 2023 after broadly keeping up with the market as a whole over the prior 10 years. As for our “Amazon Survivors” index, it’s lagged the market somewhat so far this year but not dramatically.
Both of these indices outperformed dramatically in 2020 and 2021 but then gave all that boom back. It’s notable that these indices track stocks that are heavily exposed to tariffs given the general prevalence of Chinese-sourced goods in the consumer basket. That said, the impact isn’t uniform, with everything from used auto dealers to groceries seeing much less exposure to imports from China than the rest of the basket.
Bespoke publishes the “Death By Amazon” and “Amazon Survivors” Indices as a way to track performance of the companies most affected by the rise of AMZN. Neither index represents investment returns of an actual investment portfolio. When initially constructed, companies in the “Death By Amazon” index had to be direct retailers with a limited online presence (or core business based on physical retailing locations), a member of either the Retail industry of the S&P 1500 Index or a member of the S&P Retail Select Index, and rely on third party brands. We view these attributes as the best expression of AMZN’s threat to traditional retail. The “Amazon Survivors” index is designed to track the performance of companies which have some sort of defense against Amazon, selling goods not suited to mass e-commerce, operating e-commerce platforms of their own, or selling their own brands consumers will focus on instead of who is selling them. The indices are equally weighted, rebalanced monthly, and presented in total return terms.
To see how the two indices have been performing lately and view the full list of stocks that make up the indices, please read our newest report on the subject available to Bespoke Premium and Bespoke Institutional members.
To unlock our “Death By Amazon” and “Amazon Survivors” indices, login or start a two-week free trial to either Bespoke Premium or Bespoke Institutional.

Q1 2025 Earnings Conference Call Recaps: Target (TGT)
Bespoke’s Conference Call Recaps use AI to summarize lengthy earnings calls. The commentary below is AI-generated and then edited by Bespoke for quality control. As always, none of these summaries should be construed as recommendations to buy or sell any securities, and investors should do their own research and/or consult with a financial professional before making any investment decisions.
Our latest recap available to Bespoke subscribers covers Target’s (TGT) Q1 2025 earnings call.
![]()
Target (TGT) is one of the largest general merchandise retailers in the US, operating nearly 2,000 stores and an e-commerce platform. TGT offers a broad assortment across apparel, home goods, beauty, food, and essentials, often at trend-forward design and affordable prices. Its “stores-as-hubs” model makes TGT a destination for in-store shopping, and it’s a backbone of its digital fulfillment network. TGT faced a tough quarter as comparable sales fell 3.8% and traffic declined 2.4%, pressured by soft discretionary spending and five months of falling consumer confidence. Despite the challenges, strength emerged in same-day services (+36%) and seasonal promotions (Valentine’s Day, Easter). Executives highlighted Target Circle 360 growth, momentum in Roundel and Target Plus, and progress on shrink reduction. A newly formed Enterprise Acceleration Office will drive faster decision-making and AI integration. With tariffs looming, TGT is diversifying its sourcing to avoid price hikes, while continuing to invest in store remodels and tech infrastructure. The stock opened 6.7% lower on 5/21% after missing EPS and revenue estimates…
Continue reading our Conference Call Recap for TGT by becoming a Bespoke Institutional subscriber. You can sign up for Bespoke Institutional now and receive a 14-day trial to read our newest Conference Call Recap. To sign up, choose either the monthly or annual checkout link below:
Q1 2025 Earnings Conference Call Recaps: Wix.com (WIX)
Bespoke’s Conference Call Recaps use AI to summarize lengthy earnings calls. The commentary below is AI-generated and then edited by Bespoke for quality control. As always, none of these summaries should be construed as recommendations to buy or sell any securities, and investors should do their own research and/or consult with a financial professional before making any investment decisions.
Our latest recap available to Bespoke subscribers covers Wix.com’s (WIX) Q1 2025 earnings call.
![]()
Wix.com (WIX) is a cloud-based platform that allows users ranging from entrepreneurs and freelancers to creative professionals and large agencies to create, manage, and grow an online presence. Known for democratizing website building, WIX has expanded its ecosystem to include e-commerce tools, booking systems, and AI-powered design and automation capabilities. WIX reported 12% YoY bookings growth to $511M and revenue up 13% to $474M. The company launched two major AI products: Wixel, a standalone visual design platform integrated into Microsoft Copilot, and Astro, an embedded AI assistant aimed at improving user engagement. The Q1 cohort outperformed expectations, generating $36M in bookings (a 12% YoY increase) driven by strong conversion, product upgrades, and increased adoption of high-tier packages. Partners revenue grew 24% YoY, and transaction revenue rose 19% as more merchants adopted Wix Payments. The stock fell as much as 14.4% on 5/21 after posting weaker-than-expected results…
Continue reading our Conference Call Recap for WIX by becoming a Bespoke Institutional subscriber. You can sign up for Bespoke Institutional now and receive a 14-day trial to read our newest Conference Call Recap. To sign up, choose either the monthly or annual checkout link below: