Bespoke’s Morning Lineup – 5/30/25 – Farewell to May
See what’s driving market performance around the world in today’s Morning Lineup. Bespoke’s Morning Lineup is the best way to start your trading day. Read it now by starting a two-week trial to Bespoke Premium. CLICK HERE to learn more and start your trial.
“If you don’t occasionally make a mistake, you’re not doing your job.” – Jim Sinegal

Below is a snippet of commentary from today’s Morning Lineup. Start a two-week trial to Bespoke Premium to view the full report.
There wasn’t a lot of action going on in the markets this morning. That was up until just a few minutes ago when the President started “truthing” about China, and said “No more Mr. Nice Guy!” Futures on both the S&P 500 and Nasdaq quickly went from unchanged to down about 0.5%. European stocks were higher but have given up some of their gains, while Asian stocks fell on the on/off/now back on Trump tariffs. Like the equity market, treasuries are little changed. Crude oil is one of the bigger movers this morning with a gain of just over 1% while gold, the dollar, and crypto are all in the red.
It may be Friday, but there’s a busy batch of economic data on the calendar with Personal Income and Spending, PCE, Chicago PMI, and Michigan Sentiment.
One of the more high-profile earnings reports since yesterday’s close was Costco (COST), which reported better than expected EPS on inline sales and an 8% increase in comp sales. COST is trading marginally lower in response to the report, with the stock on pace to gap down about 0.5% at the open. What’s notable about this morning’s weakness is that it continues a trend that has been in place for the stock since the start of 2022. As shown in the table below, not including this morning, shares of COST have gapped down in reaction to 11 of its last 13 earnings reports. Another negative open today would make it 12 out of the last 14!

The Closer – Tariffs, Claims, GDP – 5/29/25
Log-in here if you’re a member with access to the Closer.
Looking for deeper insight into markets? In tonight’s Closer sent to Bespoke Institutional clients, we lead off with some commentary regarding the latest updates to tariff policies in addition to a dive into the latest jobless claims data (page 1) including a breakdown by demographics (pages 2 and 3). We then review today’s update of GDP and the latest earnings from Costco (COST) (pages 4).

See today’s full post-market Closer and everything else Bespoke publishes by starting a 14-day trial to Bespoke Institutional today!
Q1 2025 Earnings Conference Call Recaps: Salesforce (CRM)
Bespoke’s Conference Call Recaps use AI to summarize lengthy earnings calls. The commentary below is AI-generated and then edited by Bespoke for quality control. As always, none of these summaries should be construed as recommendations to buy or sell any securities, and investors should do their own research and/or consult with a financial professional before making any investment decisions.
Our latest recap available to Bespoke subscribers covers Salesforce’s (CRM) Q1 2026 earnings call.

Salesforce (CRM) is the world’s leading customer relationship management (CRM) platform, providing cloud-based software that helps businesses manage sales, service, marketing, and commerce. The company powers many of the world’s largest enterprises and is widely recognized for pioneering Software-as-a-Service (SaaS). Its real competitive edge today lies in its AI + Data + CRM strategy, led by innovations like Agentforce (digital labor platform) and Data Cloud (enterprise data unification). Salesforce serves over 150,000 customers, including companies across technology, healthcare, retail, government, and financial services. It offers a unique view into enterprise software trends, digital transformation, and now, the evolution of AI in large organizations. Agentforce, now in over 8,000 deals and 800 active deployments, dominated the call as Salesforce’s answer to the agentic AI wave. The $8B Informatica acquisition was framed as strategic, accretive, and essential to Salesforce’s data harmonization ambitions. Flex Credits (consumption pricing) and SMB strength signaled growth from both model evolution and market reach. Risks noted: EMEA softness, AI deployment complexity, and macro caution. Guidance held steady, but enterprise AI remains a slower build than consumer hype implies…
Continue reading our Conference Call Recap for CRM by becoming a Bespoke Institutional subscriber. You can sign up for Bespoke Institutional now and receive a 14-day trial to read our newest Conference Call Recap. To sign up, choose either the monthly or annual checkout link below:
Q1 2025 Earnings Conference Call Recaps: NVIDIA (NVDA)
Bespoke’s Conference Call Recaps use AI to summarize lengthy earnings calls. The commentary below is AI-generated and then edited by Bespoke for quality control. As always, none of these summaries should be construed as recommendations to buy or sell any securities, and investors should do their own research and/or consult with a financial professional before making any investment decisions.
Our latest recap available to Bespoke subscribers covers NVIDIA’s (NVDA) Q1 2026 earnings call.
![]()
NVIDIA (NVDA) is the global leader in accelerated computing, designing GPUs, networking hardware, and software that power AI, gaming, data centers, and industrial digitalization. Best known for its CUDA-enabled GPU platforms like Hopper and Blackwell, the company enables everything from AI model training and inference to robotic automation. NVDA’s technology forms the backbone of AI infrastructure across hyperscalers, enterprises, and sovereign governments. NVDA delivered $44B in revenue (up 69% YoY), powered by a 73% surge in data center sales driven by its new Blackwell architecture. Over 70% of compute revenue came from Blackwell as hyperscalers ramped up NVL72 rack deployments. Inference demand soared, with Microsoft processing over 100T tokens in Q1 and startups tripling output on B200 chips. Despite recognizing $4.6B in H20 sales to China, new US export controls forced a $4.5B write-down and halted $2.5B in shipments. The company highlighted over 100 sovereign AI factory projects and onshore manufacturing efforts in Arizona and Texas. NVDA beat expectations on the top and bottom lines for the tenth consecutive quarter, and the stock opened 5.3% higher on 5/29 as a result…
Continue reading our Conference Call Recap for NVDA by becoming a Bespoke Institutional subscriber. You can sign up for Bespoke Institutional now and receive a 14-day trial to read our newest Conference Call Recap. To sign up, choose either the monthly or annual checkout link below:
Chart of the Day – UST Issuance
Bespoke’s Morning Lineup – 5/29/25 – Nvidia At Post DeepSeek Highs
See what’s driving market performance around the world in today’s Morning Lineup. Bespoke’s Morning Lineup is the best way to start your trading day. Read it now by starting a two-week trial to Bespoke Premium. CLICK HERE to learn more and start your trial.
“No technology has ever had the opportunity to address a larger part of the world’s GDP than AI.” – Jensen Huang
Below is a snippet of commentary from today’s Morning Lineup. Start a two-week trial to Bespoke Premium to view the full report.
To see yesterday’s CBNC interview, click on the image below.

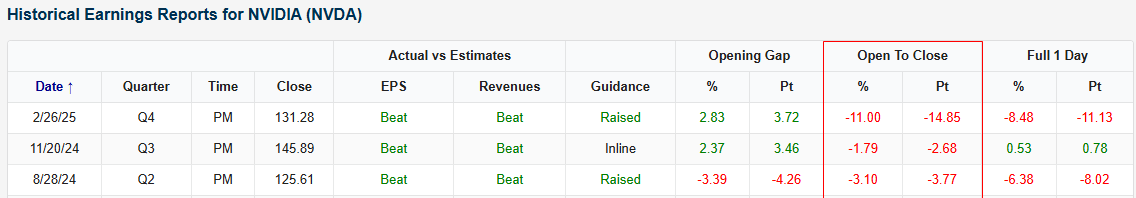
The biggest report of the earnings season has come and gone, but as Nvidia CEO Jensen Huang said on last night’s call, “This is just the beginning.” At least that’s what NVDA bulls are hoping. Based on pre-market levels, shares of NVDA are looking at an upside gap of over 5%. That would be the stock’s biggest upside gap in reaction to earnings since last May, and as we highlighted in Tuesday’s Chart of the Day, would extend its streak of positive reactions to May reports to four.
NVDA’s current pre-market levels are at the high end of the range the stock has traded in since the DeepSeek news first hit markets in late January. If NVDA can build on these gains during the trading day, it would be notable for two reasons. First, it would indicate a breakout from the post-DeepSeek range (shaded area in the chart below). More importantly, it would help to reverse a trend where the stock has repeatedly capped rallies with intraday negative reversals (see arrows in the chart below).

This trend has also been evident on the stock’s recent earnings reaction days. Following the last three earnings reports, the stock has sold off from the open to close, including in February when it sank 11% after initially gapping up nearly 3%.
The Closer – NVDA Earnings, GSEs, Shorts – 5/28/25
Log-in here if you’re a member with access to the Closer.
Looking for deeper insight into markets? In tonight’s Closer sent to Bespoke Institutional clients, we kick off with a rundown of the long awaited NVIDIA (NVDA) earnings (page 1). We also recap the Fed Minutes (page 2) in addition to some commentary regarding GSEs like Fannie Mae and Freddie Mac (pages 3 and 4). After updating our Five Fed Manufacturing Composite (page 5), we round out tonight’s report with a look into the change in short interest levels (page 6).

See today’s full post-market Closer and everything else Bespoke publishes by starting a 14-day trial to Bespoke Institutional today!
Q1 2025 Earnings Conference Call Recaps: Dick’s Sporting Goods (DKS)
Bespoke’s Conference Call Recaps use AI to summarize lengthy earnings calls. The commentary below is AI-generated and then edited by Bespoke for quality control. As always, none of these summaries should be construed as recommendations to buy or sell any securities, and investors should do their own research and/or consult with a financial professional before making any investment decisions.
Our latest recap available to Bespoke subscribers covers Dick’s Sporting Goods’ (DKS) Q1 2025 earnings call.
![]()
Dick’s Sporting Goods (DKS) is the largest US-based full-line sporting goods retailer, offering athletic apparel, footwear, equipment, and outdoor gear through its core banners: DICK’S, Golf Galaxy, Public Lands, and specialty concepts like House of Sport and Field House. Serving athletes of all ages, DKS caters to a broad consumer base prioritizing fitness, team sports, and wellness. Its growing omnichannel capabilities, experiential store formats, and digital platforms like GameChanger and the DICK’S Media Network give it unique insight into youth sports and evolving consumer engagement. DKS delivered 4.5% comp growth for the fifth straight quarter, driven by strength across footwear, apparel, and team sports. Average ticket rose 3.7%, transactions were up 0.8%, and e-commerce growth outpaced overall growth. Management reaffirmed guidance despite tariff uncertainty, citing strong pricing control. Key growth areas include expanding experiential formats (House of Sport and Field House), accelerating digital sales, and scaling GameChanger and the Media Network. The newly announced $1.1B acquisition of Foot Locker was also a hot topic on the call. Despite missing estimates, the stock was up 6% at the open on 5/28, but fell intraday, giving up most of the gains…
Continue reading our Conference Call Recap for DKS by becoming a Bespoke Institutional subscriber. You can sign up for Bespoke Institutional now and receive a 14-day trial to read our newest Conference Call Recap. To sign up, choose either the monthly or annual checkout link below:
Q1 2025 Earnings Conference Call Recaps: AutoZone (AZO)
Bespoke’s Conference Call Recaps use AI to summarize lengthy earnings calls. The commentary below is AI-generated and then edited by Bespoke for quality control. As always, none of these summaries should be construed as recommendations to buy or sell any securities, and investors should do their own research and/or consult with a financial professional before making any investment decisions.
Our latest recap available to Bespoke subscribers covers AutoZone’s (AZO) Q3 2025 earnings call.
![]()
AutoZone (AZO) is the largest retailer and distributor of automotive replacement parts and accessories in the United States, serving both professional mechanics and do-it-yourself (DIY) customers. With over 7,000 stores across the US, Mexico, and Brazil, it provides everything from batteries and brake pads to diagnostic tools and repair advice. AutoZone operates a hybrid retail-commercial model, with hub and mega hub stores that enable rapid parts delivery. The company offers insight into consumer vehicle maintenance habits, used car market dynamics, and macro trends in aftermarket automotive demand. AZO’s Q3 results highlighted a strong rebound in commercial sales, up 10.7%, and a steady 3% increase in DIY comps, its best retail growth since FY22. The company is aggressively expanding its mega hub footprint (now at 119 locations) and opened two new US distribution centers for faster deliveries. Discretionary DIY categories remain pressured, but core maintenance and failure parts are growing. Tariffs are a watch item, but management believes mitigation strategies will preserve margins. AZO beat top-line estimates, but came up short of the mark on EPS, and the stock fell 3.8% on 5/27…
Continue reading our Conference Call Recap for AZO by becoming a Bespoke Institutional subscriber. You can sign up for Bespoke Institutional now and receive a 14-day trial to read our newest Conference Call Recap. To sign up, choose either the monthly or annual checkout link below: