Q1 2026 Earnings Conference Call Recaps: Toll Brothers (TOL)
Bespoke’s Conference Call Recaps use AI to summarize lengthy earnings calls. The commentary below is AI-generated and then edited by Bespoke for quality control. As always, none of these summaries should be construed as recommendations to buy or sell any securities, and investors should do their own research and/or consult with a financial professional before making any investment decisions.
Our latest recap available to Bespoke subscribers covers Toll Brothers’ (TOL) Q2 2026 earnings call.
![]()
Toll Brothers (TOL) builds luxury homes and master-planned communities across the US, serving affluent move-up, first-time luxury, and active-adult buyers. The company stands out for its high-end locations and large Design Studio upgrade business. Toll also offers insight into upper-income consumer health, housing demand at the luxury end of the market, land competition, and how wealthy buyers are reacting to rates, stock market volatility, and economic uncertainty. TOL beat revenue and EPS estimates in a housing market most builders still describe as difficult. Management said affluent buyers remain resilient thanks to stock market gains, home equity, and wage growth, with 23% of buyers paying all cash and mortgage Loan-to-Values (LTVs) averaging just 69%. Florida and Austin were standout markets, including a West Palm Beach community selling $3 million homes at a $2 million monthly pace with low-30% gross margins. The company also highlighted progress in reducing finished spec inventory by 28%, selling homes earlier in construction to drive more high-margin Design Studio spending. On better-than-expected results, TOL shares rose 8.5% on 5/20…
Continue reading our Conference Call Recap for TOL by becoming a Bespoke Institutional subscriber. You can sign up for Bespoke Institutional now and receive a 14-day trial to read our newest Conference Call Recap. To sign up, choose either the monthly or annual checkout link below:
Q1 2026 Earnings Conference Call Recaps: CAVA (CAVA)
Bespoke’s Conference Call Recaps use AI to summarize lengthy earnings calls. The commentary below is AI-generated and then edited by Bespoke for quality control. As always, none of these summaries should be construed as recommendations to buy or sell any securities, and investors should do their own research and/or consult with a financial professional before making any investment decisions.
Our latest recap available to Bespoke subscribers covers CAVA’s (CAVA) Q1 2026 earnings call.
![]()
CAVA (CAVA) operates one of the fastest-growing restaurant concepts in the US, serving customizable Mediterranean bowls, pitas, salads, dips, and proteins through a fast-casual format that prides itself on healthier options and convenience without heavy discounting. The company has become a standout traffic story in restaurants by attracting both higher-income customers trading up to premium items like steak and salmon, and lower-income customers still willing to spend for fresher food and perceived value. CAVA reported 9.7% same-store sales growth driven by 6.8% traffic growth, while many peers continue reporting sluggish consumer demand. Management said strength remained broad across regions and income groups, with lower-income consumers actually outperforming despite macro uncertainty and rising fuel costs. The company said new restaurants are opening above 100% productivity with $3 million AUVs and highlighted strong guest response to white sweet potatoes and its new nationwide salmon launch. Executives also emphasized investments in labor, hospitality, loyalty engagement, and internally built AI and data systems aimed at predictive prep, staffing, and personalized marketing. Shares were up 3% on 5/20 in reaction to EPS and revenue beats…
Continue reading our Conference Call Recap for CAVA by becoming a Bespoke Institutional subscriber. You can sign up for Bespoke Institutional now and receive a 14-day trial to read our newest Conference Call Recap. To sign up, choose either the monthly or annual checkout link below:
Q1 2026 Earnings Conference Call Recaps: NVIDIA (NVDA)
Bespoke’s Conference Call Recaps use AI to summarize lengthy earnings calls. The commentary below is AI-generated and then edited by Bespoke for quality control. As always, none of these summaries should be construed as recommendations to buy or sell any securities, and investors should do their own research and/or consult with a financial professional before making any investment decisions.
Our latest recap available to Bespoke subscribers covers NVIDIA (NVDA) Q1 2027 earnings call.
![]()
NVIDIA (NVDA) designs the chips and software that power modern AI. Its GPUs are the engine behind virtually every major AI model being built and run today, making Nvidia the closest thing the industry has to a toll booth on the entire AI economy. Revenue hit $81.6 billion, up 85% from a year ago, with the sequential jump of $13.5 billion from last quarter setting a new company record in dollar terms. Agentic AI, meaning AI that can actually do useful work on its own, has arrived, and every major AI lab is racing to produce more tokens on Nvidia hardware. Blackwell, its current flagship chip, achieved the fastest product ramp in the company’s history, with data center revenue reaching $75 billion, up 92% year over year. VeraRubin, the next chip platform, ships in Q3, and management expects every major AI lab to adopt it immediately, projecting up to 35x higher inference throughput compared to Blackwell. Vera, a brand-new standalone processor built specifically for AI agents, opens a $200 billion market that NVDA has never competed in before, with nearly $20 billion in CPU revenue already in sight for this year. China is still completely excluded from guidance, and there is no visibility on when that will change. NVDA shares are down 1.7% after reporting a triple play…
Continue reading our Conference Call Recap for NVDA by becoming a Bespoke Institutional subscriber. You can sign up for Bespoke Institutional now and receive a 14-day trial to read our newest Conference Call Recap. To sign up, choose either the monthly or annual checkout link below:
Chart of the Day: Gray Haired Diamond Hands
Bespoke’s Morning Lineup – 5/21/26 – Stocks High, Sentiment Low
See what’s driving market performance around the world in today’s Morning Lineup. Bespoke’s Morning Lineup is the best way to start your trading day. Read it now by starting a two-week trial to Bespoke Premium. CLICK HERE to learn more and start your trial.
“To have a comeback, you have to have a setback.” – Mr. T

Below is a snippet of commentary from today’s Morning Lineup. Start a two-week trial to Bespoke Premium to view the full report.
Equity futures this morning are lower, but it’s not because of Nvidia (NVDA) earnings. Those are basically shaping up to be a non-event. The culprit this morning is news out of Iran, as the country’s Supreme Leader said that the country will not let its enriched uranium leave the country. That lowers the odds of a peaceful solution, which has oil prices moving higher and equity prices lower. The S&P 500 looks to open down about 0.4% while the Nasdaq is down 0.6%.
As mentioned, crude oil is up about 3%, treasury yields are higher, gold is down about 0.6%, and Bitcoin is fractionally lower.
In Asia, Japan rallied 3.1% while South Korea surged more than 8% as the strike at Samsung was averted. China bucked the positive tone, though, and fell 2%. In Europe, equities are lower across the board with the STOXX 600 down 0.3% as flash PMI indices for the region largely missed expectations.
It’s been a busy morning for data already in the US, and the results have been mixed. Jobless claims were basically in line with forecasts, the Philly Fed for May missed expectations, while Building Permits and Housing Starts came in better than expected.
For all the focus the media puts on Nvidia (NVDA) earnings, the stock is poised to gap up 0.52% today as the market rates the report a snoozer. To put that in perspective, shares of Walmart (WMT) are priced to gap down 2.4% at the open. Today’s moves continue a trend where a relatively ‘boring’ stock like WMT has had a more volatile initial reaction to earnings than NVDA. Including today’s reaction, shares of WMT have had a larger gap (in terms of magnitude) than NVDA for six of the last eight quarters. While NVDA’s average gap on earnings reaction days in the last eight quarters has been 2.6%, WMT’s average gap has been +/-3.6%.
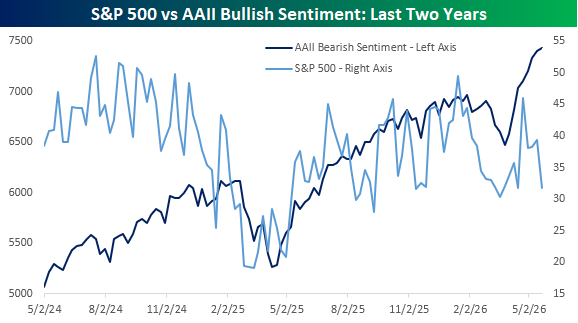
The S&P 500 closed within 0.2% of a 52-week high yesterday, so you would expect investors to feel more optimistic, but the latest sentiment survey from the American Association of Individual Investors (AAII) showed the opposite. In this week’s survey, bullish sentiment declined from 39.3% down to 31.7% while bearish sentiment spiked up to 43.6% for a bull-bear spread of -11.9. Historically, when the S&P 500 was within 1% of a 52-week high, the bull-bear spread was positive 14.6!
Start a two-week trial to Bespoke Premium to continue reading today’s full Morning Lineup.
Q1 2026 Earnings Conference Call Recaps: Home Depot (HD)
Bespoke’s Conference Call Recaps use AI to summarize lengthy earnings calls. The commentary below is AI-generated and then edited by Bespoke for quality control. As always, none of these summaries should be construed as recommendations to buy or sell any securities, and investors should do their own research and/or consult with a financial professional before making any investment decisions.
Our latest recap available to Bespoke subscribers covers Home Depot (HD) Q1 2026 earnings call.

Home Depot (HD) is the world’s largest home improvement retailer with 2,360+ stores serving both homeowners and professional contractors across virtually every repair, renovation, and construction category. It’s the first call to make if you want a read on the American housing market. Q1 was steady but uninspiring, with sales up 4.8% to $41.8B and same-store sales up just 0.6%. The housing market freeze remains the central drag. With mortgage rates elevated and existing home sales below 4 million, homeowners are avoiding big renovation projects, and management was candid that their improved second-half outlook is essentially a bet on storm activity returning to normal after a historically quiet 2025. The biggest news was the acquisition of Mingledorff’s, an HVAC distributor across five Southeastern states, opening up a $100B market and pushing HD’s total addressable market to $1.2T. Professional contractors remain the bright spot, with online sales up 10%+ for the fourth straight quarter and contractor credit programs gaining traction. Tariffs and rising fuel costs are quietly building margin pressure, though HD has filed for tariff refunds as a potential offset. Full-year guidance was left unchanged at flat to 2% same-store sales growth. HD moved up 0.8% on better-than-expected results…
Continue reading our Conference Call Recap for HD by becoming a Bespoke Institutional subscriber. You can sign up for Bespoke Institutional now and receive a 14-day trial to read our newest Conference Call Recap. To sign up, choose either the monthly or annual checkout link below:
The Closer – Fed Minutes, NVIDIA (NVDA) Earnings, Stockpiles – 5/20/26
Log-in here if you’re a member with access to the Closer.
- Today’s release of the FOMC Minutes confirmed that a rump of hawkish members believe that the FOMC should remove the dovish bias from their statement.
- NVIDIA (NVDA) earnings showed that data center revenues continue to power growth with compute up 76.8% YoY and networking up 199% YoY.
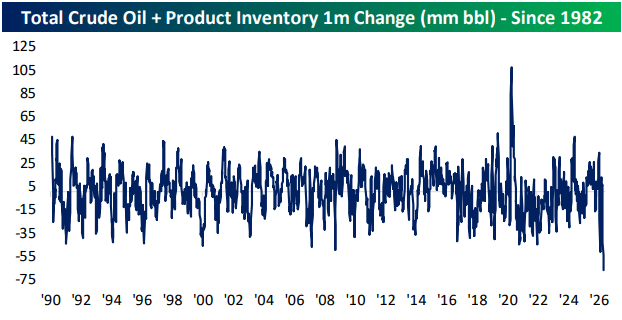
- Petroleum inventories have drawn by a record degree over the past month while net exports hover near record highs.
See today’s full post-market Closer and everything else Bespoke publishes by starting a 14-day trial to Bespoke Institutional today!
The Triple Play Report: 5/20/26
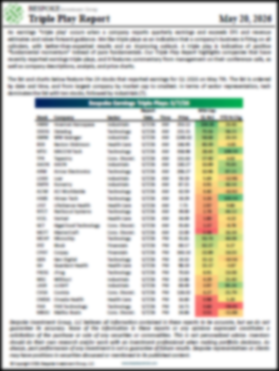
An earnings triple play is a stock that reports earnings and manages to 1) beat analyst EPS estimates, 2) beat analyst sales estimates, and 3) raise forward guidance. You can read more about “triple plays” at Investopedia.com where they’ve given Bespoke credit for popularizing the term. We like triple plays as an indication that a company’s business is firing on all cylinders, with better-than-expected results and an improving outlook. A triple play is indicative of positive “fundamental momentum” instead of pure fundamentals, and there are always plenty of names with both high and low valuations on our quarterly list.
Bespoke’s Triple Play Report covers what each company does, what this quarter’s results say about their growth outlooks, and their histories of delivering triple plays. Bespoke’s Triple Play Report is available at the Bespoke Institutional level only. You can sign up for Bespoke Institutional now and receive a 14-day trial to read today’s Triple Play Report. To sign up, choose either the monthly or annual checkout link below:
Bespoke Institutional – Monthly Payment Plan
Bespoke Institutional – Annual Payment Plan
Bespoke Investment Group, LLC believes all information contained in these reports to be accurate, but we do not guarantee its accuracy. None of the information in these reports or any opinions expressed constitutes a solicitation of the purchase or sale of any securities or commodities. This is not personalized advice. Investors should do their own research and/or work with an investment professional when making portfolio decisions. As always, past performance of any investment is not a guarantee of future results. Bespoke representatives or clients may have positions in securities discussed or mentioned in its published content.