The week that is. As for the market decline, it’s another story as to when that will end, but no matter how you slice it, stocks are trading at extremely oversold levels similar to short-term declines we saw in early 2016, August 2015, August 2011, and before that 2008. Today, equity futures are slightly higher, but is anyone going to put any trust in them at this point? We just had a big release of economic data and for the most part, the reports came in roughly in line to below expectations, but nothing was that far off the mark. Read today’s Bespoke Morning Lineup below for major macro and stock-specific news events, updated market internals, and detailed analysis and commentary:
Bespoke Morning Lineup – 12/21/18
We have two quick charts to highlight this morning. The first is the rolling 5-day change in the S&P 500 over the last ten years. As of yesterday’s close, the S&P 500 was down 6.9% over the prior five trading days. How does that stack up to the past? You may be surprised to see that back in February we actually had a sharper drop over five days. Overall, there have only been six other periods in the last ten years where the S&P 500 fell this much or more over such a short period. What’s unique about the most recent period relative to earlier this year is that the period of selling was much quicker back then. The current period has seen a lot more consistency in terms of selling, similar to 2011.

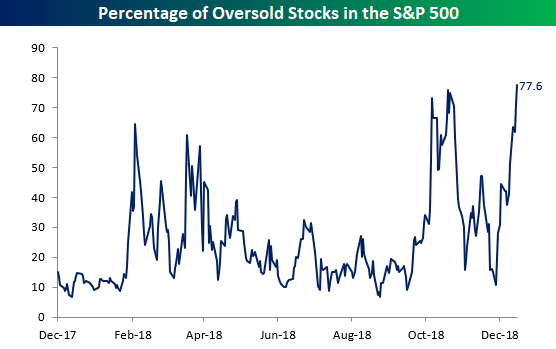
The next chart shows the percentage of oversold stocks in the S&P 500 (trading more than one standard deviation below their 50-day moving average). The current level of 77.6% is now the highest level in well over a year. In fact, you have to go back to January of 2016 to find a higher reading.
Start a two-week free trial to Bespoke Premium to see today’s full Morning Lineup report. You’ll receive it in your inbox each morning an hour before the open to get your trading day started.

