See what’s driving market performance around the world in today’s Morning Lineup. Bespoke’s Morning Lineup is the best way to start your trading day. Read it now by starting a two-week trial to Bespoke Premium. CLICK HERE to learn more and start your trial.
“This is the way the world ends, not with a bang but a whimper.” – T.S. Eliot

Below is a snippet of commentary from today’s Morning Lineup. Start a two-week trial to Bespoke Premium to view the full report.
Futures were higher heading into this morning’s economic data, and after the 8:30 batch of data, equities have built modestly on their gains. Personal Income and Personal Spending were both a tenth higher than expected, and PCE inflation was in line with forecasts at both the headline and core levels. While the inflation data was right inline, it remains at uncomfortably high levels with y/y headline coming in at 2.7% while the core reading was 2.9%. As long as these readings can stay below 3%, markets should be able to handle it.
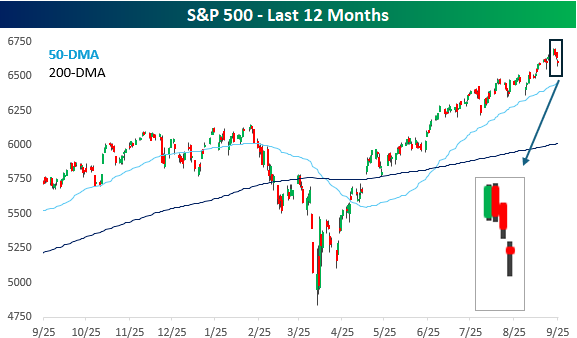
Mondays aren’t usually a day we look forward to, but looking back, it’s been the best day of the week. After riding the optimism of Fed rate cuts to record highs last week, investors took the weekend to think about it and liked what they saw. On Monday, the S&P 500 rallied for the third day in a row, hitting its eighth record high of the month and the 28th record high of the year.
Since that record high on Monday, however, the S&P 500 has traded down for three straight days and is now trading back to where it closed last Tuesday – before the Fed cut rates. Instead of optimism for lower rates, investors are increasingly worried that the market is getting ahead of itself as terms like euphoria and bubble enter the lexicon.
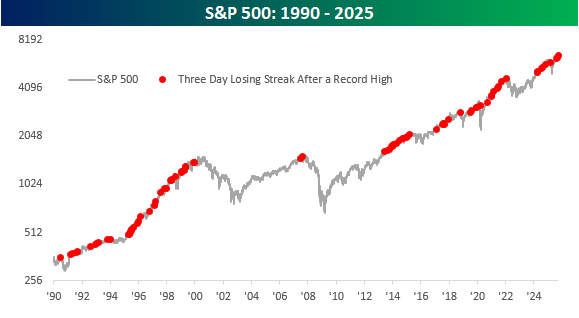
The severity of the declines this week has been extremely modest. Over the course of the three-day losing streak, the S&P 500 is down less than 1%, so if this type of ‘pullback’ makes you nervous, you’re taking too much risk. Besides the shallow nature of the decline, the fact that the S&P 500 is down three days in a row after hitting a record high is hardly unusual. The chart below shows the S&P 500 dating back to 1990, and the red dots show every three-day losing streak that followed a record closing high. Just this year, there have been three other occurrences. One occurred back in February ahead of the tariff-tantrum, but there was also another one in late July and then again in mid-August. Remember those? We didn’t either.
Looking at other occurrences, yes, similar scenarios have played out right around major market tops, but there were dozens more that no one remembers anymore. The only way we’ll know if this occurrence is a significant one is with hindsight, but the odds are that it’s not.