See what’s driving market performance around the world in today’s Morning Lineup. Bespoke’s Morning Lineup is the best way to start your trading day. Read it now by starting a two-week trial to Bespoke Premium. CLICK HERE to learn more and start your trial.
“If you absolutely can’t tolerate critics, then don’t do anything new or interesting.” – Jeff Bezos

Below is a snippet of commentary from today’s Morning Lineup. Start a two-week trial to Bespoke Premium to view the full report.
Stock futures have been rallying all night following the President’s announcement with Apple CEO Tim Cook that the company will invest up to $600 billion in the US over the next four years. Trump also announced 100% tariffs on all imports of semiconductors, but qualified that with the caveat that any companies investing in the US would be exempt from the tariff. We don’t know how this will be tracked or what constitutes significant enough investing, but the initial reaction of markets has been positive.
AAPL shares have also been screaming higher. Yesterday’s 5% gain was the biggest margin of outperformance relative to the S&P 500 since last year’s WWDC conference, and this morning, shares are up another 3%. One semiconductor stock not feeling the love this morning is Intel (INTC). Shares are down over 3% after the President called for the CEO’s resignation, saying in a Truth Social post that he is ‘conflicted’. We can’t remember the last time a U.S. president publicly called for the resignation of a CEO, but then again, there have been a lot of firsts under President Trump.
On the economic calendar this morning, the main reports are jobless claims at 8:30, but we’ll also get Non-Farm Productivity and Unit Labor Costs at the same time.
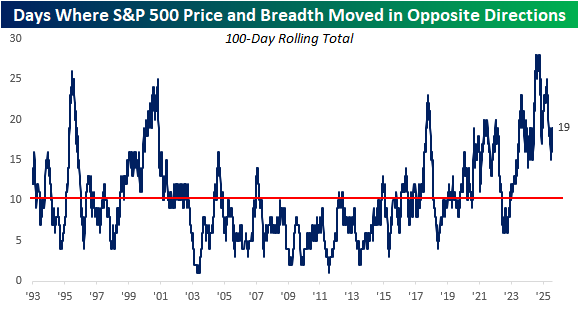
Yesterday was another one of those days when the S&P 500 moved one way, and breadth moved in the opposite direction. As the S&P 500 rallied more than 0.7%, there were 23 more stocks in the index that finished down on the day than up. As the S&P 500 has become increasingly top-heavy in recent years, the daily moves in the index have been increasingly less representative of the performance of the ‘average’ stock.
The chart below shows the rolling 100-day number of days when the S&P 500’s daily price change moved in the opposite direction as breadth. Beginning in the years right before Covid, this reading has been volatile, but the general trend has been higher. While the current level of 19 is well off the record high of 28 from last fall, right before the election, it is still nearly double the historical average of 10.
For most, the current elevated reading brings up memories of the dot-com boom (and subsequent bust), but it doesn’t have to end that way. Back in 2000, the largest stocks in the S&P 500 were incredibly overvalued, so when the bubble popped, they deflated quickly and pulled the index down with them. Today, the ten largest stocks in the index aren’t cheap, but their valuations are less out of step with the rest of the market than they were back in 2000. According to a report from SocGen, the top ten stocks in the S&P 500 account for 40% of the index’s market cap and a third of the profits. That’s an imbalance, but not an incredibly wide one.
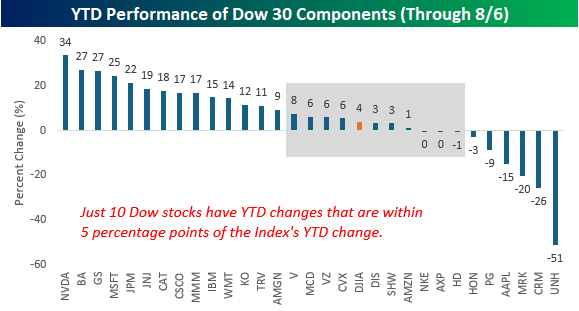
While the Dow Jones Industrial Average is hardly the most widely followed benchmark of US stock market performance, we found it interesting that the index’s 3.9% YTD gain is hardly representative of the YTD performance of the index’s 30 components. As shown in the chart below, just ten stocks in the index have YTD returns that are within five percentage points of the index’s change, and more than half (16) have YTD performances that are at least ten percentage points higher or lower than the index.