
See what’s driving market performance around the world in today’s Morning Lineup. Bespoke’s Morning Lineup is the best way to start your trading day. Read it now by starting a two-week trial to Bespoke Premium. CLICK HERE to learn more and start your trial.
“The distance between insanity and genius is measured only by success” – Ian Fleming

Below is a snippet of commentary from today’s Morning Lineup. Start a two-week trial to Bespoke Premium to view the full report.
Markets are taking a breather this morning as the US and Iran trade missile and drone strikes. The S&P 500 looks poised to open 0.2% lower, while the Nasdaq is down 0.33%. After a brief excursion below $90, WTI crude oil is back above $90, gold is down over 1%, and the 10-year yield is up 3 bps to 4.51%.
Asian stocks were mostly lower overnight, with the Nikkei down 0.5% and Hong Kong falling 1.3%. The Shanghai Composite bucked the trend, finishing with a marginal gain, but even South Korea finished the session lower, falling 0.5%. South Korea down? Outside of the rising tensions between the US and Iran, there was no obvious catalyst for the declines in the region.
In Europe, events in the Middle East have also weighed on equities. The STOXX 600 is down close to 1%. Led lower by the UK, while Italy bucks the trend with a gain. Hawkish comments from the ECB’s Chief Economist also haven’t helped.
In the US today, there’s a monster slate of data on the calendar with Personal Income, Personal Spending, PCE, Jobless Claims, Durable Goods, and GDP all at 8:30, followed by New Homes Sales at 10 AM, as well as Energy inventories at 10:30 and 12:00.
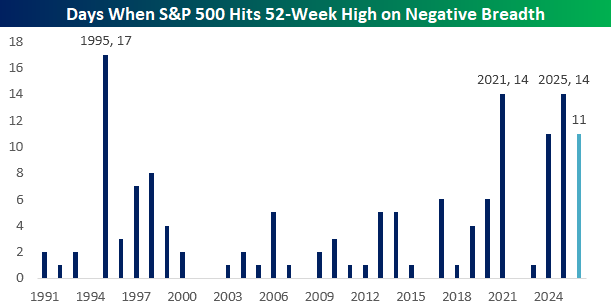
Yesterday was another one of those days when the S&P 500 hit a 52-week high, but breadth was negative. So far this year, these types of daily divergences have occurred 11 times, and if that brings back memories of the late 1990s, it shouldn’t.
As shown in the chart below, we’re not even fully five months into the year, but this year already ranks tied for fourth in the number of days when the S&P 500 closed at a 52-week high but breadth was negative. The only years with more occurrences were 1995 (17), 2021, and 2025, with 14. If you look at the late 1990s, though, in 1998 it happened only eight times all year, in 1999 there were only four occurrences, and in 2000, it only happened twice.
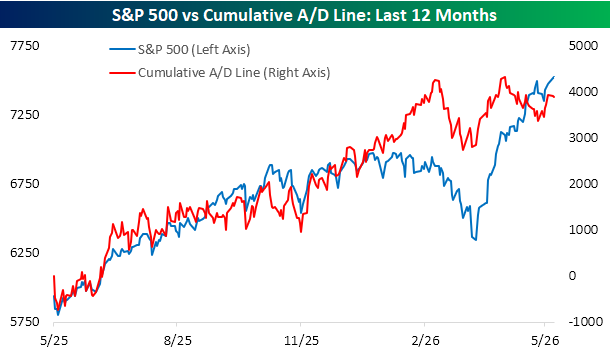
Regarding breadth, the S&P 500’s cumulative advance/decline line continues to diverge from price. On 4/20, the cumulative A/D line made a marginal new high, but ever since then, it’s been biased to the downside, even as the S&P 500 has rallied close to 6%.
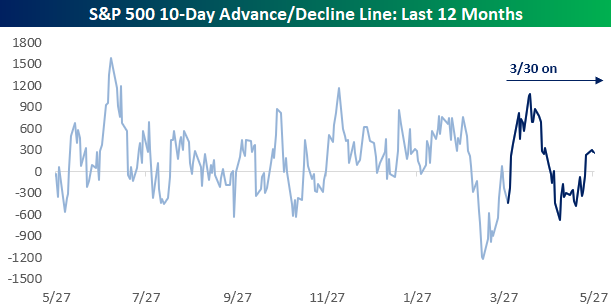
At least there have been some signs that breadth is modestly improving. The chart below shows the S&P 500’s 10-day A/D line over the last year, with the period from 3/30 shown in dark blue. While breadth was positive in the early days of the rally, from late April through just before Memorial Day weekend, it was negative before moving modestly back into positive territory this week. Breadth could still use a lot of improvement, but you have to start somewhere!
Start a two-week trial to Bespoke Premium to continue reading today’s full Morning Lineup.
