See what’s driving market performance around the world in today’s Morning Lineup. Bespoke’s Morning Lineup is the best way to start your trading day. Read it now by starting a two-week trial to Bespoke Premium. CLICK HERE to learn more and start your trial.
“I felt that if I stayed with them I would probably end up being the richest man in the cemetery.” – Ron Wayne, Co-Founder, Apple (AAPL)

Below is a snippet of commentary from today’s Morning Lineup. Start a two-week trial to Bespoke Premium to view the full report.
Wait, is this some upside follow-through the market is seeing this morning? Equity futures are firmly higher this morning as the S&P 500 is indicated to open 0.9% higher, while the Nasdaq is up over 1%. Treasury yields are lower, with the 10-year yield down below 4.3%, while crude oil is down 3% to $98.5 per barrel. Brent crude, more sensitive to Iran events, is also down 2.5% to $101.4. That price is way below the levels it was quoted at yesterday, but that’s because the contract rolled overnight. Gold prices are up 2.5% to more than $2,760 per ounce, and Bitcoin is up over 1%. If these levels can hold into the end of the trading day, bulls will likely start to feel a bit more emboldened.
What a night the markets had in Asia. Markets in the region were sharply higher with the Nikkei surging 5.2%, and if you think that was impressive, look at the 8.4% rally in South Korea! Besides rebounding on the overall global relief rally on signs of a potential withdrawal from Iran, officials in South Korea noted that the country has ample supplies of helium and ethylene to last through the first half of the year. PMI Manufacturing reports for the region all remained in contraction territory, suggesting that the region’s economy is withstanding the impacts of the Iran war for now.
European markets were mostly closed when markets surged higher yesterday afternoon, so they played catch-up today. The STOXX 600 is up over 2%, as is the case with every regional market, including Italy and Spain, which are both up over 3%. Here again, PMI Manufacturing indices for the region were mostly positive, with Spain being the only notable laggard as it dipped into contraction territory.
Turning back to the US, it’s a busy morning for economic data with ADP Employment (higher than expected: 62K vs 40K forecast), Retail Sales (better than expected), Manufacturing PMIs, and Business Inventories all on the calendar. Besides those releases, we’ll also hear from a few Fed speakers and get auto sales for March throughout the day.
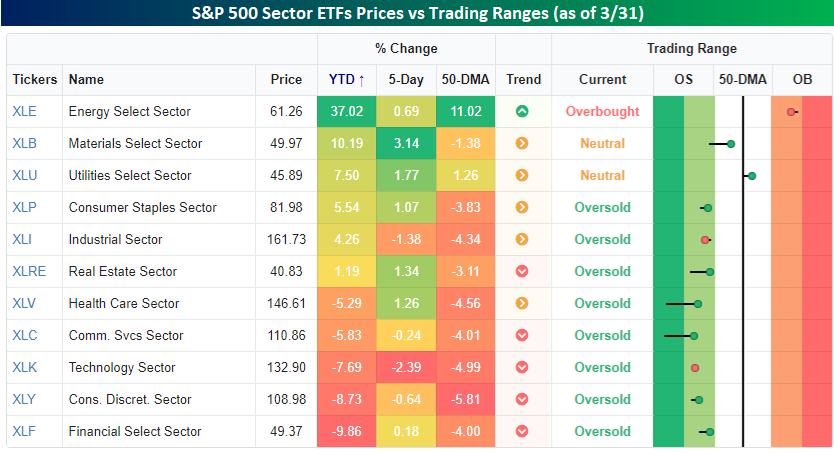
2026 is now behind us, and already it’s been an eventful year for the world and the markets. Our focus here is on markets, so we’ll start with what’s going on in the US, and specifically the S&P 500. The snapshot below from our Trend Analyzer shows the performance of the eleven different sector ETFs during Q1 and where they closed relative to their trading ranges.
Starting with performance, it has been one of, if not the widest, performance gaps between the top and bottom performing sectors in Q1 that we can remember. Topping the list, Energy (XLE) has rallied more than 37% this year, while Financials (XLF) is down just under 10%. While the S&P 500 is down more than 4% this week, just over half of all sectors finished higher in Q1, while five declined. Interestingly or unfortunately, depending on your perspective, all the sectors that are lower YTD have declined at least 5%. At the other end of the spectrum, four of the six sectors that are higher YTD are up more than 5%. The only two sectors that haven’t rallied or declined more than 5% are Industrials (XLI) and Real Estate (XLRE). Talk about the haves versus the have-nots!
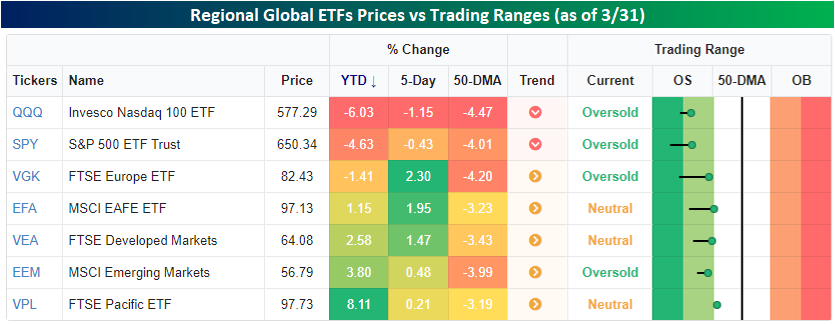
Looking out across the world, US stocks have outperformed their global peers since the war started at the end of February, but on a YTD basis, global stocks have still outperformed. As shown below, the Nasdaq 100 (QQQ) and S&P 500 (SPY) finished the first quarter down 6.03% and 4.63%, respectively, while most other regional ETFs are all higher, except Europe (VGK), which is down just 1.41%. Regardless of the paths they have taken in the first three months of the year, they all finished Q1 in either oversold territory or just barely outside of it.
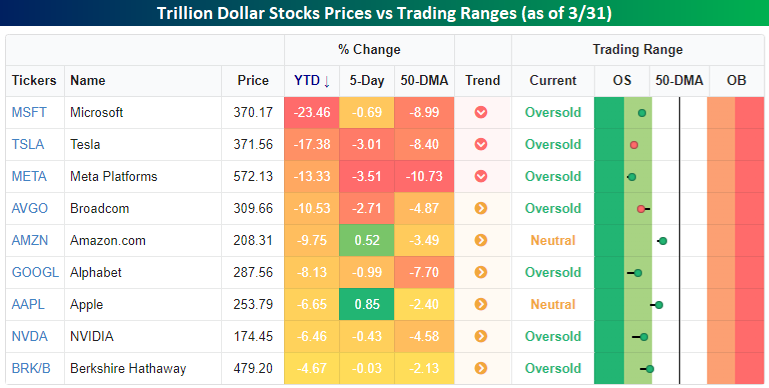
Finally, a newsflash. Remember the days when the mega-caps traded as a monolith in terms of their outperformance relative to the rest of the world? In 2025, the correlation between the trillion-dollar stocks started to break down as they went their separate ways. In Q1, the mega-caps returned to more of a positive correlation in that they all underperformed the S&P 500 in the quarter. While the degree of underperformance varied widely, the fact that all nine of these stocks, which account for nearly 40% of the entire index, suggests that the other 491 have done just fine. In fact, they finished the quarter with an average gain of 1.02%!