See what’s driving market performance around the world in today’s Morning Lineup. Bespoke’s Morning Lineup is the best way to start your trading day. Read it now by starting a two-week trial to Bespoke Premium. CLICK HERE to learn more and start your trial.
“The longest way must have its close – the gloomiest night will wear on to a morning.” ― Harriet Beecher Stowe

Below is a snippet of commentary from today’s Morning Lineup. Start a two-week trial to Bespoke Premium to view the full report.
A negative week is on pace to finish with a negative session as the S&P 500 looks to finish lower for the fourth week in a row and the sixth down week in the last seven. S&P 500 and Nasdaq futures are both down about 0.5% but off their overnight lows. Where we close, though, will depend almost entirely on the price of oil, which is down 1% to $95.15 per barrel. Treasury yields are modestly higher, with the 10-year yield just under 4.3%, while gold is up 1.3% and Bitcoin is holding above $70K.
In Asia overnight, most major equity indices in the region were lower, although the KOSPI rallied 0.3% to finish up 5.4% for the week. In Europe, we’re seeing more muted performance to close out the week. The STOXX 600 is down 0.1%, which would put it down more than 2% for the week, but Spain has bucked the negative trend, rallying 1% today and putting it into positive territory for the week.
There’s no economic or major earnings data on the calendar today, so geopolitical headlines will dictate the market’s performance.
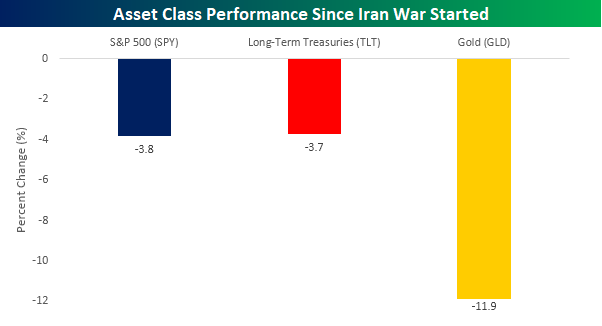
Heading into today’s session, the S&P 500 is down nearly 4% this month, which is unsurprising given the war in the Middle East. It’s only natural in times of geopolitical uncertainty for investors to move out of riskier assets into the safety of treasuries or even gold, the ultimate port in geopolitical storms. So, how are those two asset classes doing this month? Long-term treasuries, as proxied by the iShares 20+ Year Treasury ETF (TLT), are down 3.7%, which is basically in line with the S&P 500, while gold (GLD) is down more than triple either of the other two, with a decline of 11.9%. Just when you think you have it all figured out.
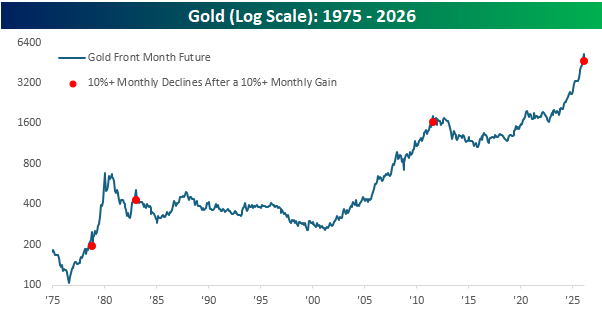
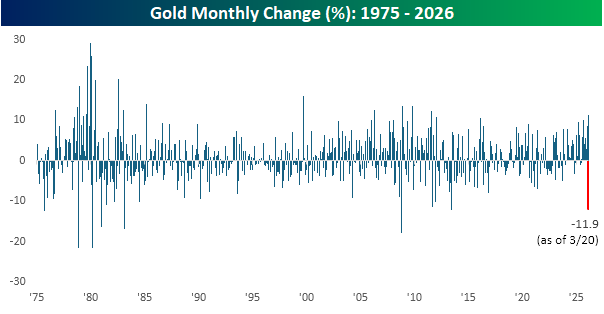
Gold’s double-digit percentage decline this month is on pace for the largest monthly decline in the commodity since June 2013 and, if it holds, would rank as the eighth largest one-month decline in gold since at least 1975. What’s even more interesting is that this month’s decline follows a double-digit percentage gain in February.
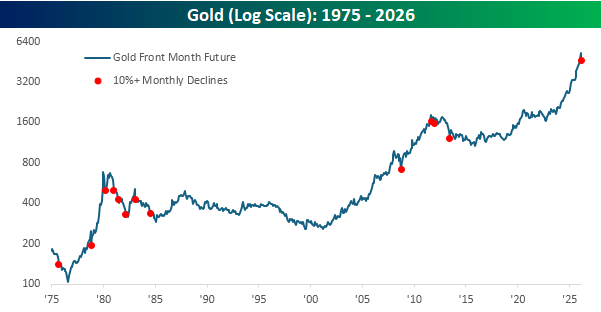
The chart below shows gold’s performance since 1975, and each red dot shows months when it declined 10% or more. Most of these declines occurred either early on or well into longer-term downtrends. There were some exceptions, though. The decline in October 2008 occurred right near the low for that period, and after the decline in November 1978, gold more than tripled over the next year.
Looking at just the periods when gold declined by at least 10% following a double-digit percentage gain. Here, the sample size is much smaller, with just three other occurrences. The two most recent, in 2011 and 1983, were followed by years of weakness, while the one other occurrence in 1978 was the one period where gold quickly tripled.