See what’s driving market performance around the world in today’s Morning Lineup. Bespoke’s Morning Lineup is the best way to start your trading day. Read it now by starting a two-week trial to Bespoke Premium. CLICK HERE to learn more and start your trial.
“I’ve noticed that when people are joking they’re usually dead serious, and when they’re serious, they’re usually pretty funny.” – Jim Morrison

Below is a snippet of commentary from today’s Morning Lineup. Start a two-week trial to Bespoke Premium to view the full report.
As investors await Wednesday’s Fed meeting, there’s a modestly positive bias to futures as the S&P 500 knocks on the door of a new high. There’s no economic data on the calendar, so the main area of focus is Wednesday’s Fed meeting, where the market is pricing in a greater than 90% chance of a 25 bps rate cut. While a rate cut is a near certainty, the odds of another cut in January are relatively low, and the consensus is that Powell’s commentary will be hawkish.
Stocks in Asia got off to a mixed start on little news. The Nikkei finished marginally higher, but Hong Kong was down over 1% and China was up fractionally as export data showed a 5.9% y/y increase versus forecasts for growth of just 3.8%. Japan’s Q3 GDP was weaker than expected, falling 0.6%, so the slower growth, coupled with higher inflation, spells out a tough recipe for the BoJ.
European stocks are also showing little direction this morning as the STOXX 600 is little changed, and no individual country benchmark index is up or down 0.3%.
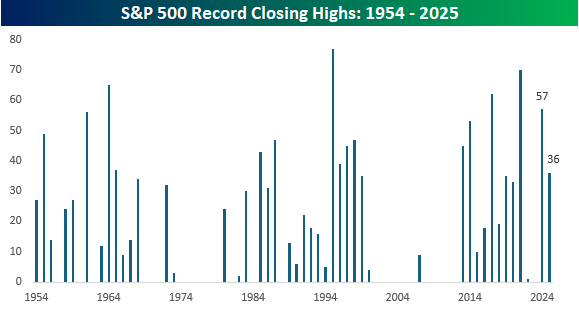
It’s been 28 trading days since the S&P 500 last closed at a record high right before the Fed’s last meeting and Powell’s hawkish cut on 10/29. As we approach this Wednesday’s meeting, though, the S&P 500 is just 30 bps from that October high and its 37th record closing high of the year. With just 17 trading days left this year, even if we hit a record high on every remaining day this year, it wouldn’t be enough to overtake last year’s total of 57, but even if there wasn’t another record high again this year, 36 is still an impressive total.
Since 1953, when the five-trading-day week in its current form started, the average number of record closing highs by year is 18.5. As the chart below illustrates, though, the number can vary widely. In 28 of the last 73 years, there have been no record highs, so there were plenty of valleys after deep bear markets where the market had to rally back over the course of years to dig out of its hole. Earlier this century, there was a six-year drought from 2001 through 2006, and then after just nine record highs in 2007, there was another five-year drought from 2008 through 2012.
Since 2013, there has been just one year without any record highs, while there was just one in 2022. This chart, more than anything, illustrates the nature of the secular bull market US stocks have been in for the last decade or more. As the chart illustrates, though, these periods don’t last forever.
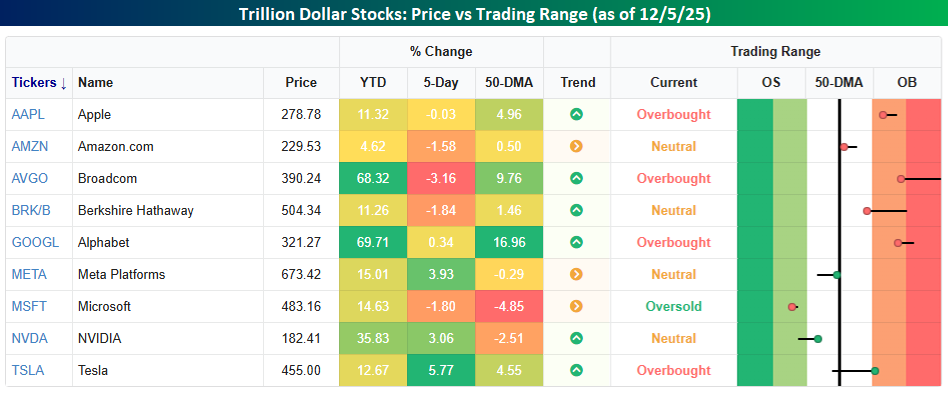
Whether the new highs start flowing again will likely be dictated by the performance of the trillion-dollar stocks. Collectively, the nine stocks in the S&P 500 with market caps of at least a trillion account for nearly 40% of the S&P 500. What’s interesting to note about these nine stocks is that while they’re all up YTD, only three of them – Alphabet (GOOGL), Broadcom (AVGO), and Nvidia (NVDA) – are outperforming the S&P 500 YTD. Not only that, but last week, more than half of them were down, so it’s not as though the group, as a cohort, has become wildly extended. Certain stocks may be overbought in the short-term, but there are also stocks like Meta (META), Microsoft (MSFT), and NVDA that head into the week below their 50-DMAs.