See what’s driving market performance around the world in today’s Morning Lineup. Bespoke’s Morning Lineup is the best way to start your trading day. Read it now by starting a two-week trial to Bespoke Premium. CLICK HERE to learn more and start your trial.
“Scientific knowledge advances haltingly and is stimulated by contention and doubt.” – Claude Lévi-Strauss

Below is a snippet of commentary from today’s Morning Lineup. Start a two-week trial to Bespoke Premium to view the full report.
Hope everyone in the States had a great Thanksgiving! Futures are halted this morning following a technical glitch on the CME, but equity ETFs tracking the S&P 500 and Nasdaq are indicated to open up 0.34% and 0.51% respectively, on this holiday-shortened day. Small caps are also higher with the Russell 2000 poised to open up 0.33%, although that won’t even be enough to erase the declines seen in the final half hour of trading on Wednesday. Treasury yields are little changed relative to Wednesday’s close, while crude oil and gold are both up about 0.60%. Even Bitcoin isn’t doing much this morning as it hovers just above $91K, although that’s a big improvement from the $86K level it was at on Wednesday afternoon.
Today may not seem like an important day, with many people taking the day off and the market open for only 3.5 hours, but it is coming down to the wire on the S&P 500’s six-month winning streak. Heading into today, the S&P 500 is down 0.40%, which is only slightly more than SPY’s current pre-market gain. So grab your popcorn, and don’t hit the mall just yet!
In most Asian markets, trading activity to close out the week was generally positive, adding to an already positive week. The one exception was South Korea, where the KOSPI fell 1.5%, taking its YTD gain down to just below 2% on the week. In Japan, CPI came in at 2.8% y/y, which was slightly higher than expected. Despite that increase, a BoJ policymaker contended that underlying inflation remains below their 2% target.
In Europe, trading is very quiet so far this morning, with the STOXX 600 up 0.1%, but the index and the individual country benchmarks that underly it are all firmly in positive territory for the week. French CPI data for November unexpectedly declined 0.1% versus expectations for an unchanged reading.
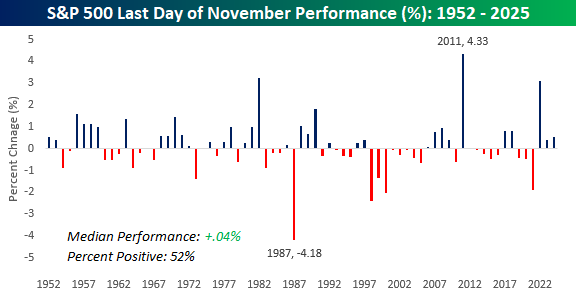
From a market perspective, there was a lot to be thankful for yesterday, especially given where it stood at various points in the year. As we head into the last day of the penultimate month of 2025, we wanted to take a quick look at how the S&P 500 has historically performed on the final trading day of November and the first trading day of December.
Earlier this week, we showed how Black Friday has historically been a positive day for stocks, with the S&P 500 averaging a one-day gain of 0.24%. However, Black Friday isn’t usually the last trading day of the month, and market performance hasn’t been particularly strong on that day. Since the five-trading-day week in its current form began in late 1952, the S&P 500’s median performance on the last trading day of the month has been a gain of 0.04% with positive returns 52% of the time.
The worst year was in 1987, when the market was still reeling from the October crash, and the S&P 500 fell 4.18% while the best day was in 2011 – another volatile year – when the S&P 500 rallied 4.33%. 2022 was the third-best performance for the last day of November when the S&P 500 saw a nice gain of 3.09% in the early weeks of the bull market. That also happened to be the exact day that ChatGPT came into our lives!
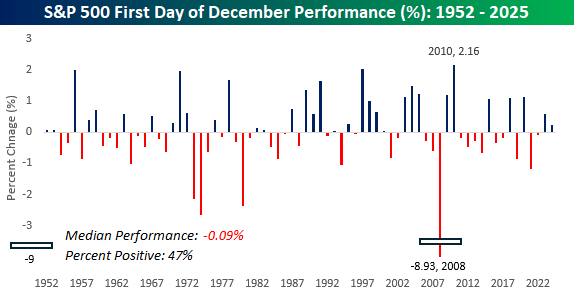
The first trading day of December has also been as bland as an overcooked turkey with no gravy. Since 1952, the S&P 500’s average performance on the first trading day of the month has been a decline of 0.09% with positive returns just 47% of the time. The best performance was a gain of 2.16% in 2010, while the worst was a year earlier in 2008, when the S&P 500 plunged 8.93%. 8.93%! Think about that for a second. We didn’t even fall that much in the latest market pullback (at least not yet), and some people were already acting like it was the end of the world, but in 2008, the S&P 500 fell that much in a single day!
If you’ve been around the block a few times, it may sound hard to believe, but there are now people with driver’s licenses and/or who are applying to college that were born after Lehman Brothers filed for bankruptcy in 2008. Time has a way of dulling memories, especially the bad ones, so for both people who weren’t around during the Financial Crisis and those who were (and just may not have been paying attention), it’s easy to forget how crazy that time was.
That 8.93% decline on the first trading day of December wasn’t just an outlier. In November 2008, the S&P 500 had a daily move of +/-5% on eight of the month’s 19 trading days, and in the three months after Lehman’s bankruptcy, there were 18. That’s more than once every four days!
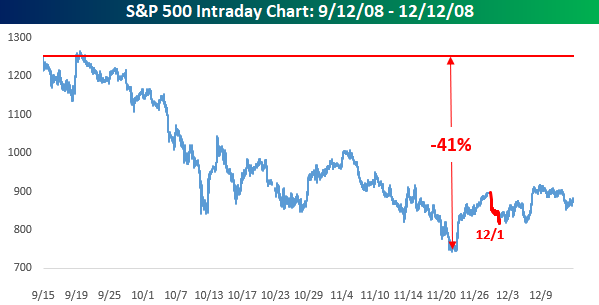
A better way to show this, though, is to look at an intraday chart of the S&P 500 in the three months following Lehman’s bankruptcy. On the Friday before Lehman went belly up, the S&P 500 closed at 1,251.70. Besides a brief period in the following days, it didn’t reach that level again for a few years, and by Thanksgiving, just over two months later, more than 40% of the S&P 500’s market value was vaporized. Also, you almost need to squint to see it, but that red ‘scratch’ on the right of the November low represents the 8.93% one-day decline from 12/1/08. In the markets, just like life, everything is relative.