Chart of the Day – Is the Long End of the Curve Signaling a Mistake?
Bespoke’s Morning Lineup – 12/9/25 – Power Outage
See what’s driving market performance around the world in today’s Morning Lineup. Bespoke’s Morning Lineup is the best way to start your trading day. Read it now by starting a two-week trial to Bespoke Premium. CLICK HERE to learn more and start your trial.
“Lesson Number One: Don’t Underestimate The Other Guy’s Greed!” – Frank Lopez, Scarface

Below is a snippet of commentary from today’s Morning Lineup. Start a two-week trial to Bespoke Premium to view the full report.
Bespoke’s Paul Hickey will be on CNBC’s Squawk on the Street today at 10 AM. Make sure to check it out!
Markets remain on snooze with little conviction in either direction this morning, and while investors “waiting for the Fed” has been the excuse, is there really any question over what Powell will say and do tomorrow? Futures are as close to unchanged as you can really get this morning, with the S&P 500 indicated to open up 1 point (0.18%) while the Nasdaq is faring “significantly” worse, down 0.06%. As we wait for the Fed, there is some economic data today. Small Business sentiment hit the tape earlier and came in modestly higher than expected, while JOLTS will hit the tape at 10 AM.
Overnight in Asia, it was a ho-hum session with the Nikkei up 0.1% while China, South Korea, and India were all down fractionally (less than 0.5%). The RBA left rates unchanged but had a hawkish tone. In Europe, the STOXX is down 0.1%.
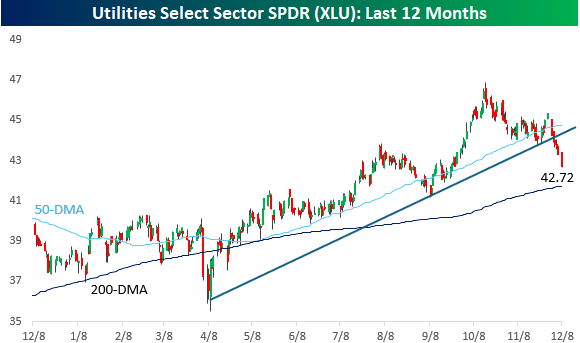
We had a power outage at the Bespoke offices yesterday afternoon, and coincidence or not, have you seen a chart of the Utilities sector recently? After being one of the better performing sectors this year, the sector started to fall on hard times since mid-October, to the point where in late November it broke its uptrend from the April lows. From there, the weakness in the sector picked up in intensity. The fact that longer-term interest rates have been rising hasn’t helped.
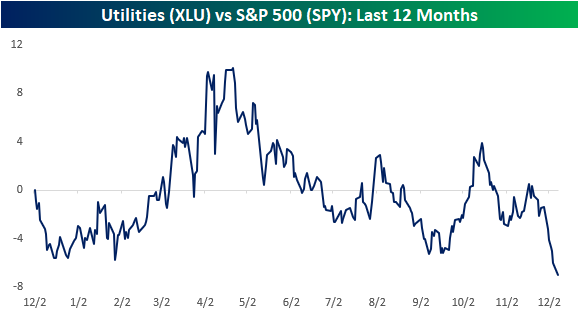
The recent weakness in the sector has also brought its relative strength versus the S&P 500 to a new low for the year. After handily outperforming during the tariff-tantrum in the Spring, the sector started performing in line with the broader market. For much of the last six months, its relative strength oscillated above and below the neutral line, but the last two weeks have seen it make a new leg lower.
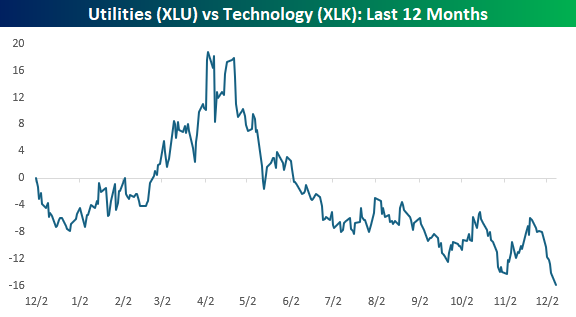
Given the power demands of AI, there have been times in the last few years when Utilities have been considered a technology play, but when you compare the sector’s performance to the Technology sector, it’s not even close. Utilities have been trending lower for the last six months.
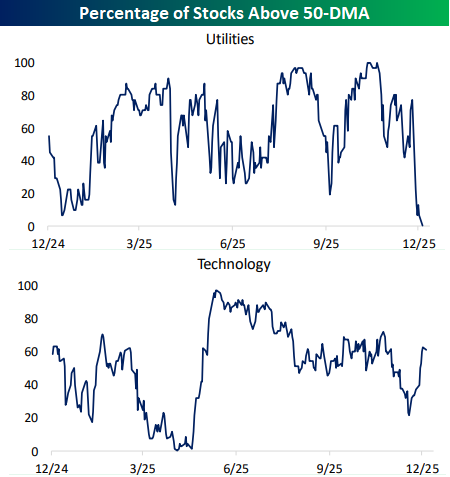
The disparity is also apparent when you compare the percentage of stocks in each sector trading above their 50-day moving averages. The Utilities are experiencing a “blackout” in this metric as not a single sector closed above its 50-DMA yesterday. That compares to more than half of stocks in the Technology sector. After some trial and error last night, Con Ed finally got the power back on in our offices last night, now they need to work on getting some power back to the sector!
The Closer – Yields, Correlations, Expectations – 12/8/25
Log-in here if you’re a member with access to the Closer.
Looking for deeper insight into markets? In tonight’s Closer sent to Bespoke Institutional clients, we begin with a look at the technical pattern in the 10-year yield in addition to what real yields are showing (page 1). We then move onto a cross-asset correlation analysis (page 2) before diving into today’s economic data that includes the New York Fed’s Survey of Consumer Expectations (pages 3 – 4) and some housing releases (pages 5 – 6).
See today’s full post-market Closer and everything else Bespoke publishes by starting a 14-day trial to Bespoke Institutional today!
Daily Sector Snapshot — 12/8/25
Consumer Stocks vs. Consumer Sentiment
While sentiment surveys show that US consumers are not very happy right now (especially boomers), many consumer-related stocks have been telling a different story lately.
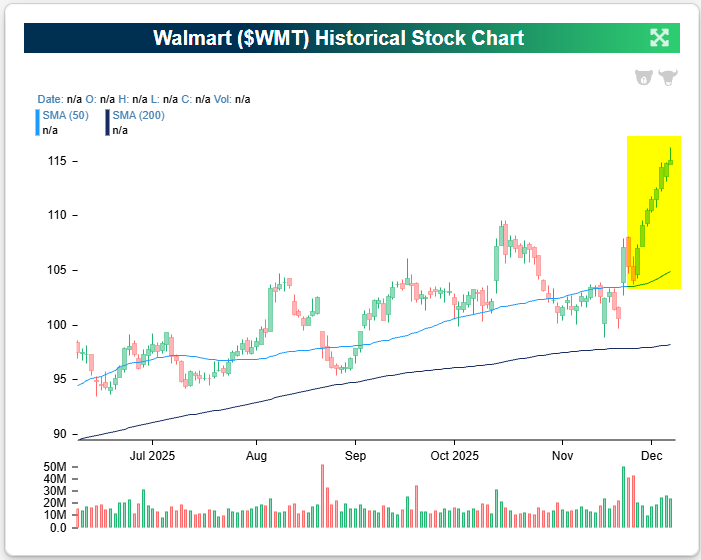
First up is a chart of Walmart (WMT), which has done nothing but trade higher since Thanksgiving:
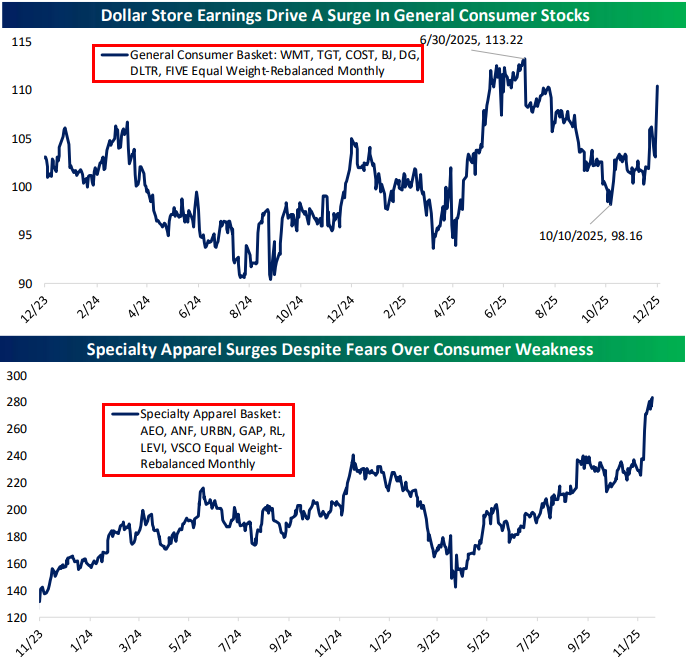
Our equally-weighted basked of general consumer stocks that includes Walmart (WMT), Target (TGT), Costco (COST), BJ’s (BJ), Dollar General (DG), Dollar Tree (DLTR), and Five Below (FIVE) has surged in the last couple of months.
Our specialty apparel basket that has well-known retailers like American Eagle (AEO), Abercrombie (ANF), Gap (GAP), and Levi’s (LEVI) has done even better with a huge jump last week to new highs.
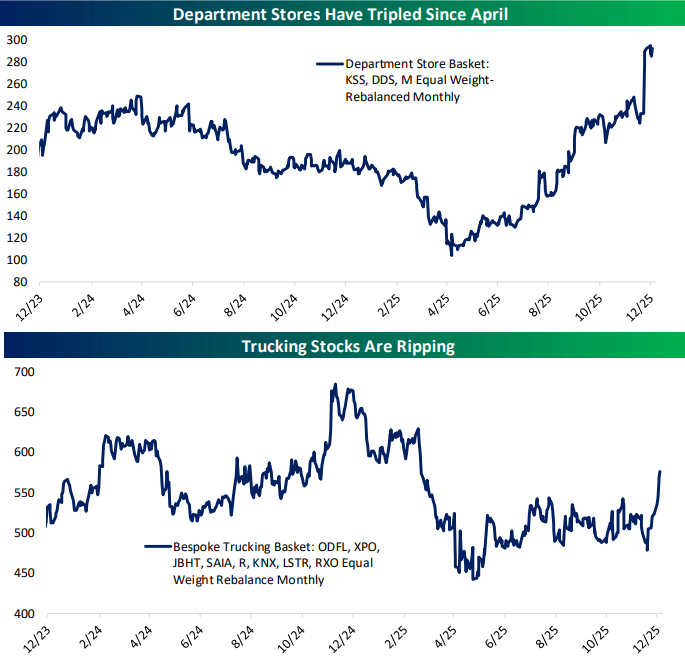
While there are only a few publicly traded department store stocks these days, this basket that includes Kohl’s (KSS), Dillard’s (DDS), and Macy’s (M) has tripled since April. Yes, tripled!
In addition, trucking stocks that deliver goods that ultimately land in the hands of consumers have been ripping over the last month.
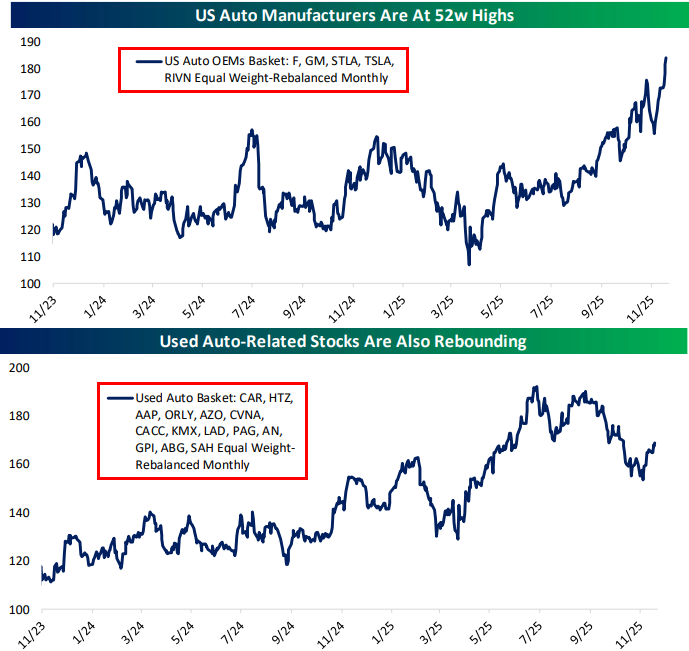
And finally, if the consumer is so weak, we wouldn’t expect to see US auto OEMs and used-car stocks performing as well as they have been lately. Check out the break to new 52-week highs recently in an equally-weighted basket of Ford (F), General Motors (GM), Stellantis (STLA), and Tesla (TSLA).
While our used-car basket isn’t at highs, it remains in an uptrend and has rebounded since the government shutdown ended a few weeks ago.
Not a Bespoke client? We’d love for you to give our equity research platform, Bespoke Premium, a try. You can sign up for complimentary access for 14 days at this link to start receiving our daily emails today!

Chart of the Day: Intraday IBIT Selling
Bitcoin has been whipsawing around $90k for the last week or so. It ended last Friday right around where it’s trading this afternoon, but it’s also down a couple thousand dollars from its highs earlier this morning before the US equity market opened at 9:30 AM ET.
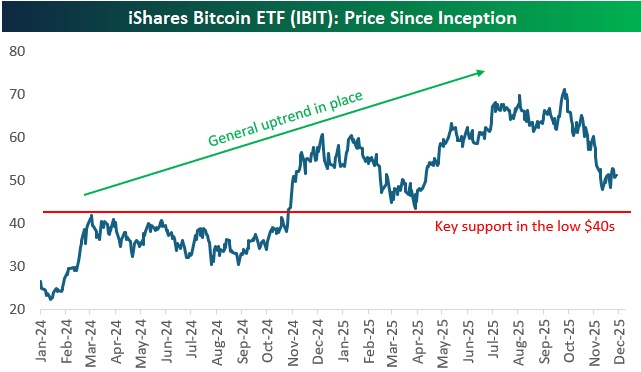
Below is a chart of the iShares Bitcoin ETF (IBIT) since it began trading in January 2024. While IBIT is in a pretty significant drawdown from its all-time high seen in October, its longer trend remains higher. A key support level has formed in the low $40s, and while we have not seen this level get tested during the current drawdown, it would be significant if this support were to break.
While the long-term chart for IBIT doesn’t look bad, the six-month chart looks pretty brutal:
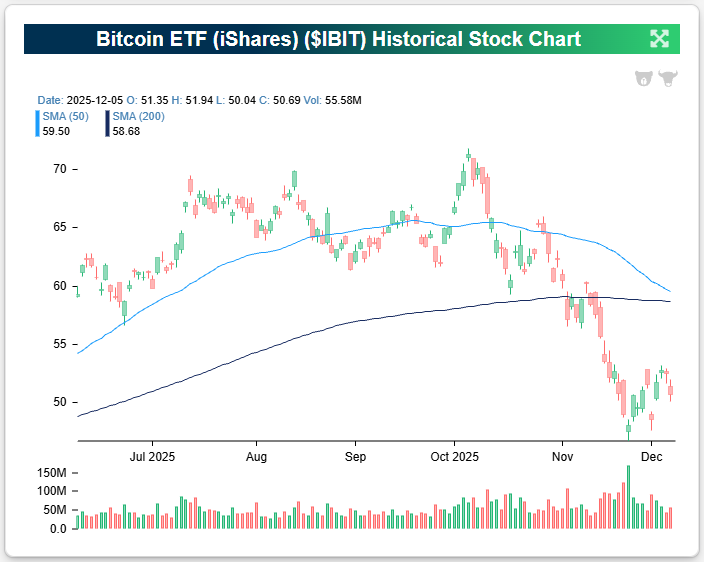
We’ve found what appears to be the problem for IBIT, which trades on US stock exchanges just like other ETFs across asset classes: it trades horribly when the stock market is open.
We looked at IBIT’s action in the six months covered in the chart above to see how it got to its 13.7% decline over this period. Amazingly…
To continue reading the remainder of our latest Chart of the Day, start a 30-day trial to Bespoke Premium or Bespoke Institutional today.

November 2025 Headlines
Bespoke’s Morning Lineup – 12/8/25 – Waiting on the Fed
See what’s driving market performance around the world in today’s Morning Lineup. Bespoke’s Morning Lineup is the best way to start your trading day. Read it now by starting a two-week trial to Bespoke Premium. CLICK HERE to learn more and start your trial.
“I’ve noticed that when people are joking they’re usually dead serious, and when they’re serious, they’re usually pretty funny.” – Jim Morrison
Below is a snippet of commentary from today’s Morning Lineup. Start a two-week trial to Bespoke Premium to view the full report.
As investors await Wednesday’s Fed meeting, there’s a modestly positive bias to futures as the S&P 500 knocks on the door of a new high. There’s no economic data on the calendar, so the main area of focus is Wednesday’s Fed meeting, where the market is pricing in a greater than 90% chance of a 25 bps rate cut. While a rate cut is a near certainty, the odds of another cut in January are relatively low, and the consensus is that Powell’s commentary will be hawkish.
Stocks in Asia got off to a mixed start on little news. The Nikkei finished marginally higher, but Hong Kong was down over 1% and China was up fractionally as export data showed a 5.9% y/y increase versus forecasts for growth of just 3.8%. Japan’s Q3 GDP was weaker than expected, falling 0.6%, so the slower growth, coupled with higher inflation, spells out a tough recipe for the BoJ.
European stocks are also showing little direction this morning as the STOXX 600 is little changed, and no individual country benchmark index is up or down 0.3%.
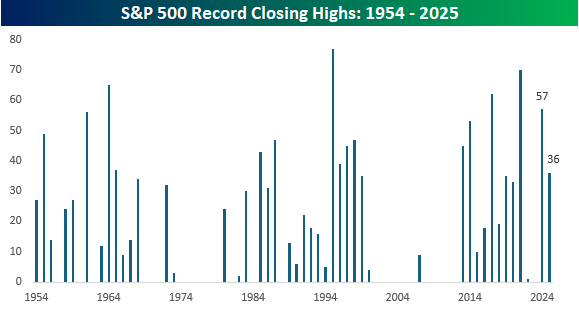
It’s been 28 trading days since the S&P 500 last closed at a record high right before the Fed’s last meeting and Powell’s hawkish cut on 10/29. As we approach this Wednesday’s meeting, though, the S&P 500 is just 30 bps from that October high and its 37th record closing high of the year. With just 17 trading days left this year, even if we hit a record high on every remaining day this year, it wouldn’t be enough to overtake last year’s total of 57, but even if there wasn’t another record high again this year, 36 is still an impressive total.
Since 1953, when the five-trading-day week in its current form started, the average number of record closing highs by year is 18.5. As the chart below illustrates, though, the number can vary widely. In 28 of the last 73 years, there have been no record highs, so there were plenty of valleys after deep bear markets where the market had to rally back over the course of years to dig out of its hole. Earlier this century, there was a six-year drought from 2001 through 2006, and then after just nine record highs in 2007, there was another five-year drought from 2008 through 2012.
Since 2013, there has been just one year without any record highs, while there was just one in 2022. This chart, more than anything, illustrates the nature of the secular bull market US stocks have been in for the last decade or more. As the chart illustrates, though, these periods don’t last forever.
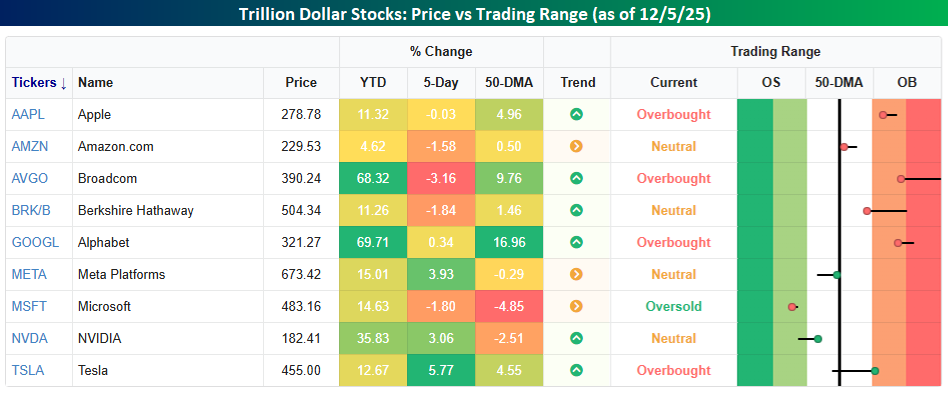
Whether the new highs start flowing again will likely be dictated by the performance of the trillion-dollar stocks. Collectively, the nine stocks in the S&P 500 with market caps of at least a trillion account for nearly 40% of the S&P 500. What’s interesting to note about these nine stocks is that while they’re all up YTD, only three of them – Alphabet (GOOGL), Broadcom (AVGO), and Nvidia (NVDA) – are outperforming the S&P 500 YTD. Not only that, but last week, more than half of them were down, so it’s not as though the group, as a cohort, has become wildly extended. Certain stocks may be overbought in the short-term, but there are also stocks like Meta (META), Microsoft (MSFT), and NVDA that head into the week below their 50-DMAs.
Brunch Reads – 12/7/25
Welcome to Bespoke Brunch Reads — a linkfest of some of our favorite articles over the past week. The links are mostly market-related, but there are some other interesting subjects covered as well. We hope you enjoy the food for thought as a supplement to the research we provide you during the week.
War Awakens the West: On the morning of December 7, 1941, the Japanese strike force, six aircraft carriers positioned 230 miles north of Oahu, launched more than 350 aircraft in two waves, attacking Pearl Harbor. Their targets were battleships, airfields, and fuel depots, with the goal of crippling the Pacific Fleet before it could interfere with Japan’s push into Southeast Asia. The attack began at 7:55 a.m. Hawaiian time. Within minutes, the USS Arizona exploded, killing over 1,100 sailors instantly. Two US Army radar operators on the north shore actually detected the incoming planes but were dismissed by a junior officer who assumed the blip was a group of American B-17s arriving from California.
By the end of the attack, more than 2,400 Americans had been killed, 19 ships were damaged or sunk, and nearly 200 planes were destroyed. But not everything went according to Japan’s plan. The US aircraft carriers Enterprise, Lexington, and Saratoga were all out at sea and survived. The Japanese also missed key infrastructure targets, including fuel farms and repair facilities. Had they destroyed those, the Pacific Fleet’s recovery would have taken far longer.
The next day, Congress declared war on Japan with just one dissenting vote. Germany and Italy declared war on the United States shortly after, finally bringing the Americans into the war. Within hours of the attack, the US government began issuing orders to round up and detain Japanese diplomats stationed in the country, a precursor to the far more sweeping internment of Japanese Americans that followed.
Within a year, the US was producing warships, tanks, and aircraft at a scale that stunned both Allied and Axis powers. In the Pacific, strategy shifted quickly from defensive to offensive, beginning with the Doolittle Raid in April 1942, a symbolic but morale-boosting strike on Tokyo, and then the pivotal Battle of Midway in June. The industrial rush, in concert with the unified political support created by the attack on Pearl Harbor, ultimately helped tilt both the European and Pacific theaters toward Allied victory. Though the attack was devastating, Japan failed to knock out the US fleet long-term and instead awakened an industrial and military sleeping giant.

Markets & Investing
“Captain Gains” on Capitol Hill (NBER)
To almost nobody’s surprise, members of Congress start trading like everyone else, but once they rise into leadership roles, their stock picks suddenly perform far better. Their advantage seems to come from two sources: influence over policy that affects certain companies, and access to corporate information that shows up in their trading before major news breaks. [Link]
Continue reading our weekly Brunch Reads linkfest by logging in if you’re already a member or signing up for a trial to one of our two membership levels shown below! You can cancel at any time.

The Bespoke Report – 12/5/25 – Finishing Where We Started
To read our weekly Bespoke Report newsletter and access everything else Bespoke’s research platform offers, start a two-week trial to Bespoke Premium.
The first full week of December was modestly positive, but what really added to the good feelings was a blackout of Federal Reserve speakers.
Futures currently price a 95% chance of a 25-basis point (bps) rate cut at Wednesday’s meeting, which is essentially the exact same as in late October. Given the lack of significant official economic data during this period, the stability in expectations makes logical sense. Without fresh data, how could Federal Open Market Committee (FOMC) members really change their outlook? Sometimes, though, what experts at the Fed —or elsewhere—say doesn’t fully make sense.
Expectations for Wednesday’s meeting haven’t changed from point to point, but the interim saw some dramatic shifts in sentiment, swinging from “they will cut” to “they won’t cut” and back to “they will cut.” Just over two weeks ago, market pricing for a cut at Wednesday’s meeting had dropped significantly to 34%. Accompanying these shifts in sentiment were major swings in stock prices. All of the major index ETFs we track in our Trend Analyzer went from overbought to oversold and back to overbought, driven almost entirely by the words of various Fed officials rather than any fundamental shifts in the US economy. Perhaps Scott Bessent was correct when he said this week, “I think it’s time for the Fed to just move back into the background like it used to do, calm things down, and work for the American people, set monetary policy on a good path…This isn’t sport, it’s people’s lives.”
This week’s Bespoke Report is packed with interesting market trends, so give the full report a read by starting a trial here.