Daily Sector Snapshot — 10/1/25
Bespoke Market Calendar — October 2025
Please click the image below to view our October 2025 market calendar. This calendar includes the S&P 500’s historical average percentage change and average intraday chart pattern for each trading day during the upcoming month. It also includes market holidays and options expiration dates plus the dates of key economic indicator releases.
Note: Due to the government shutdown, scheduled release dates are subject to change. Click here to view Bespoke’s premium membership options.
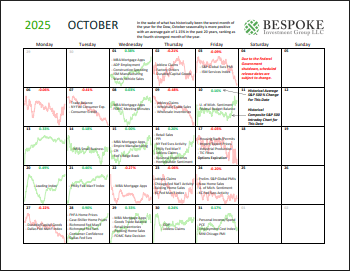
Chart of the Day – September Gains…Thank You Mega-Caps
Key ETF Performance in September, Q3, and YTD
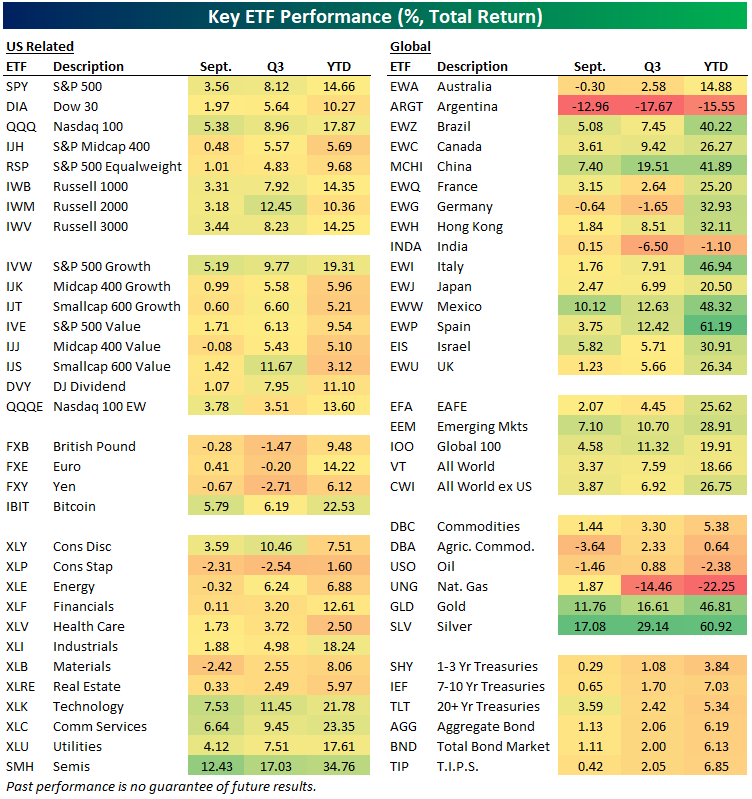
Below is a check-up on asset class performance using our key ETF matrix. For each ETF, we show its September, Q3, and YTD total return.
US index ETFs posted solid gains in both September and for all of Q3, with the Nasdaq 100 (QQQ) leading the way in September but the small-cap Russell 2,000 (IWM) leading for the full quarter. Small-cap value (IJS) did well in Q3 in particular.
Notably, the S&P 500 Equalweight (RSP) was up much less than the cap-weighted S&P (SPY) in September, as the mega-caps once again drove upside performance.
Looking outside the US, Argentina (ARGT) was the only real area of pain in September, although Germany (EWG) and Australia (EWA) were both down slightly as well. China (MCHI) and Mexico (EWW) were the two best country ETFs in September with gains of 7%+, while China (MCHI) led the way for all of Q3 with a gain of 19.5%. On the year, Spain (EWP) is still up the most at 61.2%.
Gold (GLD) and silver (SLV) were on fire in September with gains of 11.8% and 17.1%, respectively. Treasury ETFs were up slightly across the board during the month as rates fell, with longer duration up the most.

Bespoke’s Morning Lineup – 10/1/25 – Efficient Market?
See what’s driving market performance around the world in today’s Morning Lineup. Bespoke’s Morning Lineup is the best way to start your trading day. Read it now by starting a two-week trial to Bespoke Premium. CLICK HERE to learn more and start your trial.
“When one tugs at a single thing in nature, he finds it attached to the rest of the world.” – John Muir

Below is a snippet of commentary from today’s Morning Lineup. Start a two-week trial to Bespoke Premium to view the full report.
Paul Hickey appeared on CNBC’s Squawk on the Street yesterday to discuss the market setup heading into the fourth quarter. To view the segment, click on the image below.

The government shut down at midnight, and futures are moderately lower this morning, with the S&P 500 and Nasdaq trading down 0.5%. All the market-related headlines, therefore, have attributed the weakness to the shutdown, and we can only imagine that somewhere out there, Eugene Fama is smashing his head against a wall. The prospect of a shutdown has been well known for weeks now, and betting markets were pricing in a near certainty of one yesterday, so if markets really were concerned and there was even a bit of truth to the Efficient Market Hypothesis, the S&P 500 wouldn’t have traded up 0.4% yesterday. So, why is the market lower? There could be multiple reasons, and the fact that it’s the first day of a new quarter, where investors rebalance their holdings, could be one of them.
Outside of equities, US Treasury yields are modestly lower, oil is down half a percent, and gold is up 1% and above $3,900 as it marches towards $4,000 per ounce. Crypto is catching a bid with Bitcoin up 2%, while Ethereum and Solana are both up 4%.
On the data calendar this morning, we got the ADP report at 8:15, which showed an unexpected decline, and ISM Manufacturing and Construction Spending will hit the tape at 10 AM. Despite the weaker ADP report, futures have seen little reaction.
In international markets, Japan finished the first day of the quarter with a decline of nearly 1% following a weaker-than-expected Manufacturing PMI reading, while India and South Korea traded up nearly 1%. Both Hong Kong and China were closed for holidays. European stocks are higher across the board, with the STOXX 600 up 0.7% despite a slightly weaker-than-expected Manufacturing PMI reading that remained in contraction territory.
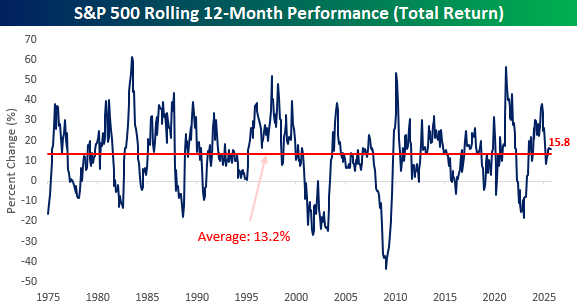
As we head into the final quarter of the year, we wanted to take a look at the 12-month moves of some major asset classes over the last five decades to see how the recent moves stack up relative to history.
Starting with equities, the S&P 500’s total return of 15.8% over the last year is surprisingly only modestly better than the long-term average of 13.2%, ranking in just the 53rd percentile relative to history. Last year at this time, the trailing 12-month return was over 35%!
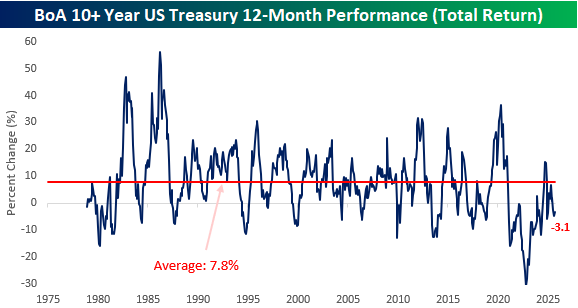
Treasury yields remain stuck in their bear market. While a decline of 3% doesn’t really seem like a big deal, we’re talking about treasuries here – traditionally referred to as a risk-free asset. Not only that, but the average 12-month return has been closer to 8%, and there have only been two months in the last five years when the trailing 12-month return was better than the long-term average.
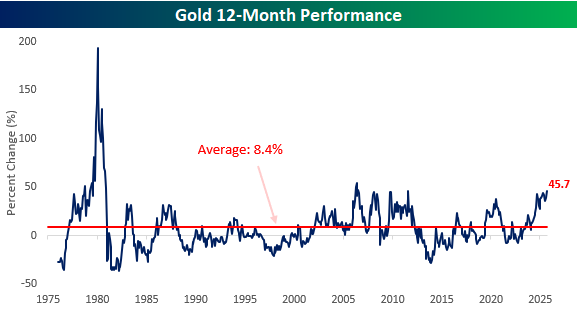
Gold is off to one of the hottest starts in decades this year, and over the last 12 months, its 45.7% gain ranks as the strongest since the mid-2000s, and the only period where there was a significantly larger 12-month gain was in the late 1970s/early 1980s.
The Closer – Chinese ADRs & EM, Jobs, BIS Triennial – 9/30/25
Log-in here if you’re a member with access to the Closer.
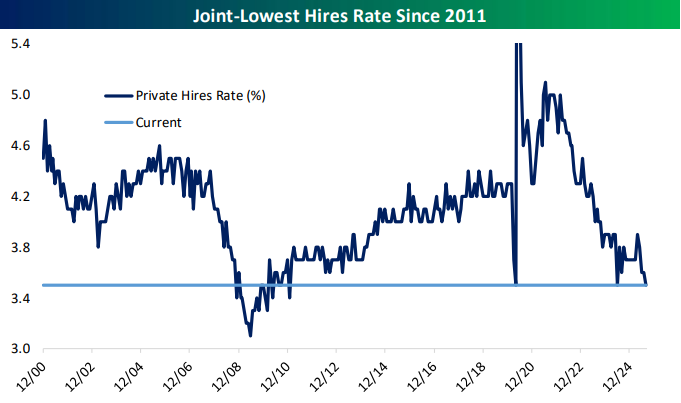
Looking for deeper insight into markets? In tonight’s Closer sent to Bespoke Institutional clients, we lead off with a look at the performance of Chinese ADRs (pages 1 and 2) in addition to the outperformance of EM equities in Q3 (page 3). Next, we dive into the latest jobs data in the form of the JOLTS report (page 4) and Indeed job postings (pages 5 and 6). After that, we review consumer confidence figures (page 7) before closing out with the triennial snapshot of FX and interest rate derivatives (pages 8 and 9).
See today’s full post-market Closer and everything else Bespoke publishes by starting a 14-day trial to Bespoke Institutional today!
Daily Sector Snapshot — 9/30/25
Chart of the Day – Shut it Down
Biggest Winners to Close Out Q3
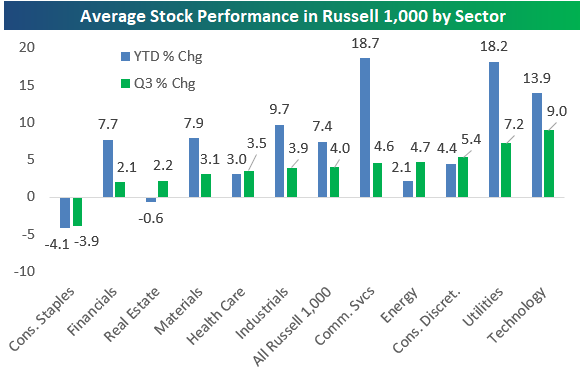
The large-cap Russell 1,000 is set to close out Q3 with a gain of roughly 7%, but the average stock in the index is up much less than that at 4%. The performance divergence is due to outperformance from mega-caps that push the cap-weighted index ever higher.
The five sectors whose stocks averaged bigger Q3 gains than the broad index (4%) are Technology (9%), Utilities (7.2%), Consumer Discretionary (5.4%), Energy (4.7%), and Communication Services (4.6%). Just one sector saw its stocks average declines in Q3: Consumer Staples (-3.9%).
Year-to-date, two sectors stand out: Communication Services and Utilities. Stocks in each of these sectors are up an average of 18%+ year-to-date through three quarters. Tech ranks 3rd at 13.9%, followed by Industrials at 9.7%.
Two sectors have seen their stocks fall year-to-date on average: Consumer Staples (-4.1%) and Real Estate (-0.6%).
Below are the 30 best performing stocks in the Russell 1,000 in Q3. There are four companies that gained more than 100% during the quarter: Sandisk (SNDK), Astera Labs (ALAB), AppLovin (APP), and MP Materials (MP). Another four gained more than 70%: Western Digital (WDC), QuantumScape (QS), Ciena (CIEN), and Wayfair (W). While there are a few names on the list of Q3’s big winners that aren’t related to AI, the AI Boom certainly made its presence felt.
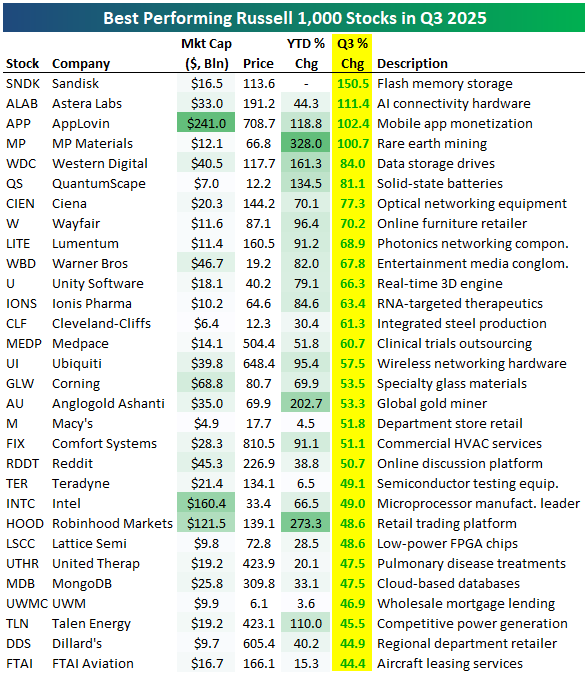
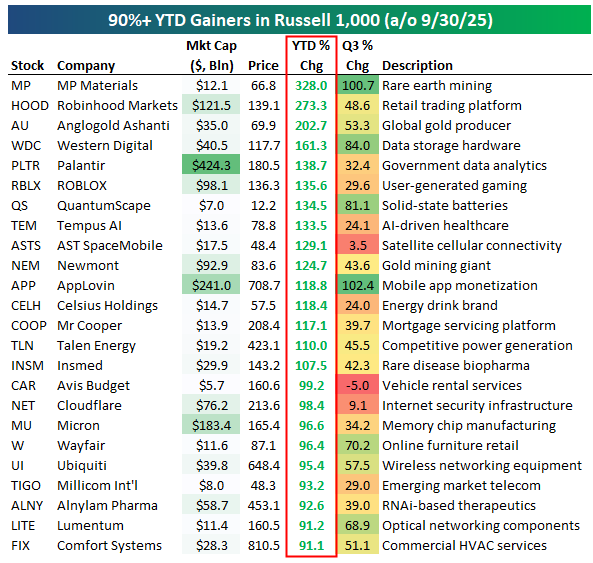
There are 24 stocks in the Russell 1,000 up 90%+ year-to-date as we close out Q3, including 15 that are up 100%+. MP Materials (MP), which gained 100% in Q3, is at the top of the leaderboard with a YTD gain of 328%. Two more stocks are up 200%+ on the year: Robinhood (HOOD) and Anglogold (AU). Western Digital (WDC) and Palantir (PLTR) round out the top five with YTD gains of 161% and 139%, respectively.
Other 100%+ winners through three quarters include social-gaming app ROBLOX (RBLX), AI healthcare platform Tempus AI (TEM), satellite cell-service provider AST SpaceMobile (ASTS), and energy-drink maker Celsius (CELH).
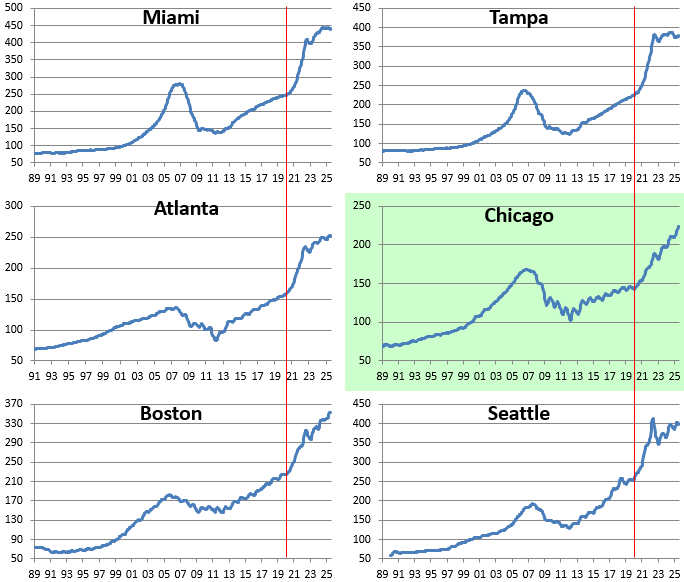
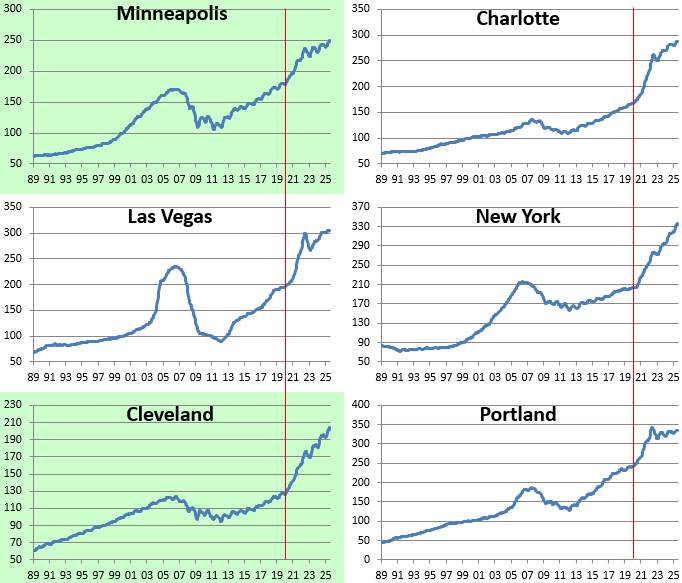
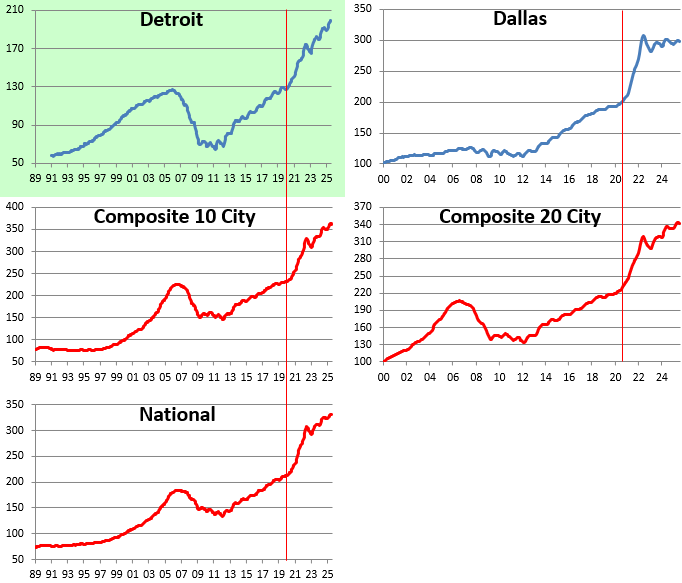
Midwest Resilience vs. Coastal Fatigue
The latest S&P Case-Shiller home price data paints a clear regional divide in the U.S. housing market. Midwest cities were up on the month and remain at all-time highs (Cleveland, Chicago, Minneapolis, Detroit), while cities in the South and West continue to struggle.
Strength in the Midwest appears to be driven by relatively lower absolute price levels, tight supply, and steady migration in from more expensive regions.
In the South and West, many metros that were pandemic-era darlings are now rolling over. Places like San Francisco, Phoenix, Seattle, Las Vegas, Tampa, and Miami all saw monthly declines and remain below all-time highs. San Francisco was down the most of any metro on the month with a drop of 0.92%, while Tampa is down the most year-over-year at -2.8%.
Along with the Midwest, major metros in the Northeast like Boston and New York that are also supply constrained remain up solidly year-over-year and were only down slightly on the month.
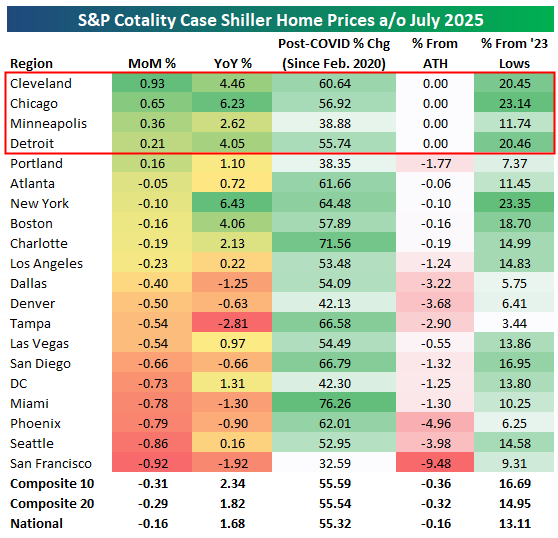
Based on the latest Case Shiller data, the dynamic has flipped: instead of “Sun Belt boom, Rust Belt lag,” the post-COVID housing cycle now features a Midwest resilience vs. coastal fatigue narrative.
Below are price charts for each of the metros tracked. The four Midwest cities that hit all-time highs in the latest month are highlighted in green.