Brunch Reads – 10/12/25
Welcome to Bespoke Brunch Reads — a linkfest of some of our favorite articles over the past week. The links are mostly market-related, but there are some other interesting subjects covered as well. We hope you enjoy the food for thought as a supplement to the research we provide you during the week.
Hacksaw’s Hero: On October 12, 1945, Private First Class Desmond T. Doss stood before President Harry Truman at the White House to receive the Medal of Honor, the nation’s highest military decoration. Doss was a pacifist who refused to carry a weapon when he was called to service in World War II, and he was mocked by fellow soldiers for his beliefs. During the battle of Okinawa, he braved relentless gunfire to rescue roughly 75 wounded men, lowering them, one by one, down a steep cliff, again without a weapon.
Truman reportedly told him, “You really deserve this. I consider this a greater honor than being President.” Doss accepted the medal with characteristic humility, saying he was only doing his duty to save lives rather than take them. In 2016, his story was told in a movie directed by Mel Gibson and starring Andrew Garfield, Hacksaw Ridge.

Media & Communications
Have we passed peak social media? (Financial Times)
Social media may have hit its breaking point. Global data show people are spending less time on platforms as feeds fill with AI-generated “slop” and fewer real interactions. Meta and OpenAI’s new ventures into automated content show how far the medium has drifted from connecting with friends toward total distraction and fighting for shortening user attention spans (except in North America, where screen time is still rising). [Link]
Continue reading our weekly Brunch Reads linkfest by logging in if you’re already a member or signing up for a trial to one of our two membership levels shown below! You can cancel at any time.

The Bespoke Report – 10/10/25 – Anniversaries
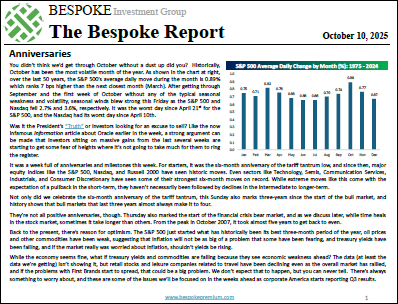
To read our weekly Bespoke Report newsletter and access everything else Bespoke’s research platform offers, start a two-week trial to Bespoke Premium. October is living up to its reputation as the most volatile month of the year! After a quiet start, markets saw a sharp drop, with the S&P 500 and Nasdaq experiencing their worst day in months. Is this a healthy pullback after historic gains, or a sign of something more? This week’s Bespoke report explored these questions and more. Give it a read!

Daily Sector Snapshot — 10/10/25
Homebuilders Struggle
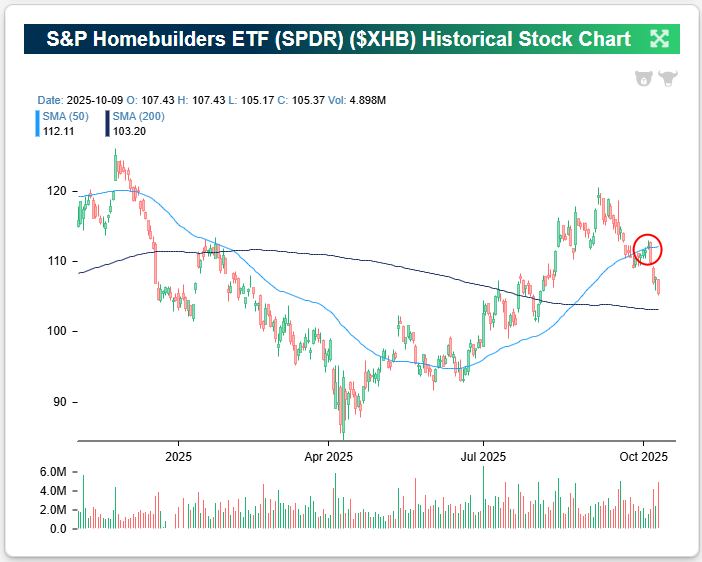
The foundation for homebuilder stocks has cracked over the last few weeks. As shown in the chart of the S&P Homebuilders ETF (XHB), an attempt to re-take the 50-DMA at the start of the week failed miserably, and the ETF enters today down 6.5% since Monday’s open.
What had been a solid uptrend off the April lows has now broken for XHB. (You can take a closer look at the chart for XHB here.)
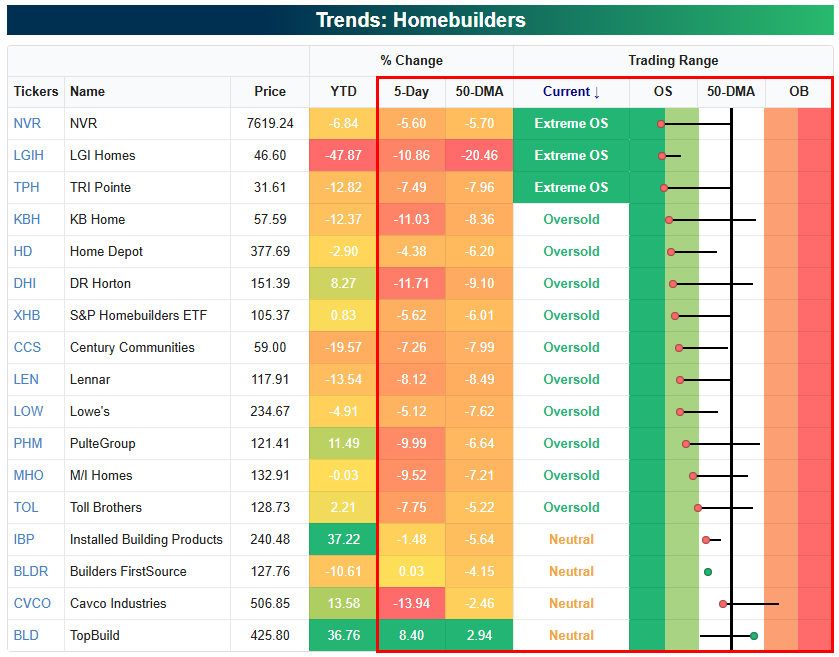
All but two homebuilder stocks in our snapshot below (from our Trend Analyzer tool) are down over the last week, with most down 5% or more. The recent move lower has left most of them in oversold territory, with three at “extreme” levels (>2 st. dev. below 50-DMA).
NVR, LGI Homes (LGIH), and TRI Pointe (TPH) are the three most oversold builders relative to their normal trading ranges, while KB Home (KBH) and DR Horton (DHI) are the next-most oversold.
The only housing-related stock in our snapshot that’s trading above its 50-DMA is TopBuild (BLD), which has bucked the trend and traded up 8% over the last week. The reason? Two days ago, TopBuild announced it was purchasing Specialty Products and Insulation – a wholesale distributor of insulation products – in an all-cash deal for $1 billion. While often-times companies doing the acquiring in an M&A transaction will initially see their shares trade lower, investors liked what they saw from this TopBuild purchase.

Bespoke’s Morning Lineup – 10/10/25 – Tech and Utilities Lead the Way
See what’s driving market performance around the world in today’s Morning Lineup. Bespoke’s Morning Lineup is the best way to start your trading day. Read it now by starting a two-week trial to Bespoke Premium. CLICK HERE to learn more and start your trial.
“If you want a happy ending, that depends, of course, on where you stop your story.” – Orson Welles

Below is a snippet of commentary from today’s Morning Lineup. Start a two-week trial to Bespoke Premium to view the full report.
US equity futures are modestly positive this morning following comments from potential Fed chair-in-waiting Christopher Waller, who said he expects the Fed to cut rates further this year, but at a ‘careful’ pace. Long-term treasury yields are notably lower as the 10-year yield trades down nearly 5 basis points to 4.10%. After dropping below $4,000 per ounce yesterday, gold is up nearly 1%, trading at $4,010. Crude oil prices are down over 1% on the prospects of peace in the Middle East, and crypto trades modestly higher at just about $121K.
With the government still shut down, the only economic data on the calendar is the University of Michigan Sentiment report, and Chicago Fed President Goolsbee will speak at a bank conference shortly after the open. Speaking of economic data, the BLS has recalled furloughed staff this morning to ensure that the September CPI report gets released by the end of the month.
Asian markets were weak overnight, with the notable exception of South Korea, which rallied 1.7%. Japan, Hong Kong, and China, however, were all down 1% or more. Japanese PPI increased 0.3% m/m, triple the rate of consensus expectations, solidified market expectations for another rate hike this year. Despite Friday’s decline, the Nikkei finished the week 5.1% higher while Hong Kong traded down 3.1% and China was up fractionally.
In Europe, equity markets have been much tamer this morning. The STOXX 600 is little changed, and no major country’s benchmark index is up or down more than 0.3%, and most are on pace to finish the week with modest gains or losses.
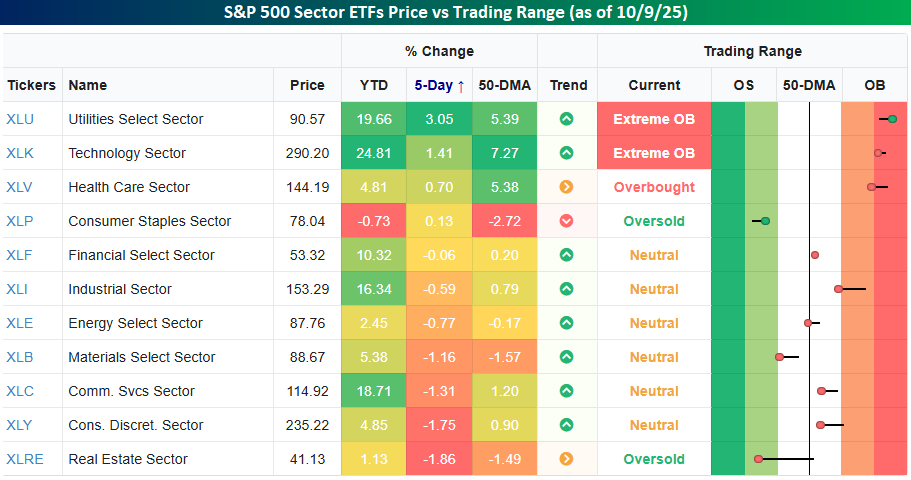
The last five trading days have been full of divergence at the sector level. The S&P 500 is fractionally higher, but seven out of eleven sectors have traded lower, including four sectors – Real Estate, Consumer Discretionary, Communication Services, and Materials – that are down over 1%. The only two sectors with gains of more than 1% are the formerly strange bedfellows of Utilities (3.05%) and Technology (1.4%). Both these sectors are also the only two trading at Extreme Overbought levels.
It wasn’t long ago that Utilities was considered the most defensive sector in the market, while Technology was considered the most risky sector. Like everything else now, it seems, AI has upended prior norms, although given the power-intensive nature of AI-related applications, the moves make sense.
Yesterday was a down day for the S&P 500, but in the seven trading days this month, there have already been five record closes, taking the YTD total to 33. If the year were to end today, 33 record highs in a year isn’t particularly noteworthy as it ranks tied for the 19th most since 1954.
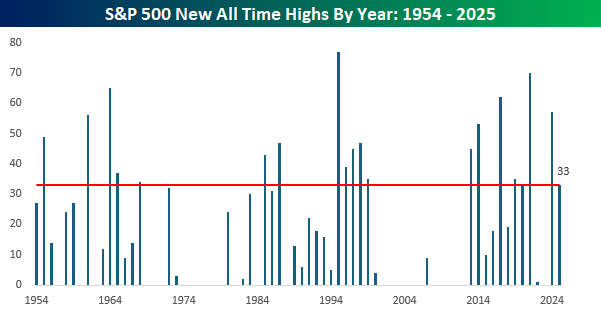
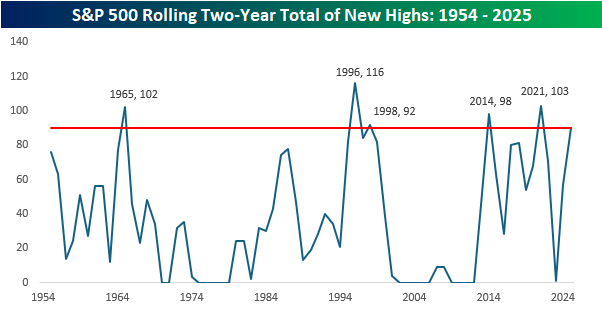
What’s been more impressive is that the 33 record closes followed last year’s total of 57. With 90 record closing highs in the last two calendar years, there have only been five other two-year stretches when the S&P 500 had more record closing highs, and not to jinx anything, but there’s a legitimate chance that by the end of the year, the last two years could end up ranking well into the top five.
Q3 2025 Earnings Conference Call Recaps: Delta Air Lines (DAL)
Bespoke’s Conference Call Recaps use AI to summarize lengthy earnings calls. The commentary below is AI-generated and then edited by Bespoke for quality control. As always, none of these summaries should be construed as recommendations to buy or sell any securities, and investors should do their own research and/or consult with a financial professional before making any investment decisions.
Our latest recap available to Bespoke subscribers covers Delta Air Lines’ (DAL) Q3 2025 earnings call.
![]()
Delta Air Lines (DAL) is one of the world’s largest and most profitable carriers, serving more than 275 destinations across six continents. The company’s revenue model extends beyond ticket sales to include high-margin businesses like loyalty programs, premium seating, maintenance services, and cargo. Delta’s SkyMiles ecosystem, anchored by its co-brand partnership with American Express, has become a key differentiator, blending travel, finance, and lifestyle benefits. Delta offers investors a window into broader consumer and corporate travel trends, economic confidence, and the health of affluent spending. The company reported record third-quarter revenue of $15.2 billion, up 4%. Corporate travel rebounded 9%, buoyed by resilient business confidence and rising demand for premium seats. Domestic main cabin revenue turned positive as competitors cut unprofitable capacity, while Transatlantic performance lagged but is being recalibrated with flatter seasonal flying. Premium and loyalty growth remain standouts. Amex remuneration rose 12% to $2 billion, and premium seat retention sits above 80%. Executives also noted deepening industry bifurcation, with Delta and United capturing the majority of airline profits. The stock was up more than 4% on 10/9 after posting stronger-than-expected results…
Continue reading our Conference Call Recap for DAL by becoming a Bespoke Institutional subscriber. You can sign up for Bespoke Institutional now and receive a 14-day trial to read our newest Conference Call Recap. To sign up, choose either the monthly or annual checkout link below:
The Closer – ETF AUM and Fee Analysis – 10/9/25
Log-in here if you’re a member with access to the Closer.
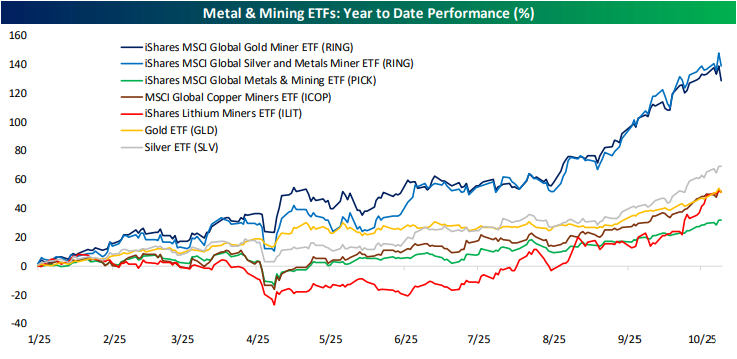
Looking for deeper insight into markets? In tonight’s Closer sent to Bespoke Institutional clients, we begin with an overview of ETF markets including the emerging dominance of Bitcoin funds (pages 1 and 2). Next we discuss breakeven employment (page 3) before closing with a checkup on metal mining stocks’ outperformance versus gold (page 4).
See today’s full post-market Closer and everything else Bespoke publishes by starting a 14-day trial to Bespoke Institutional today!
Bespoke’s Weekly Sector Snapshot — 10/9/25
Q3 2025 Earnings Conference Call Recaps: PepsiCo (PEP)
Bespoke’s Conference Call Recaps use AI to summarize lengthy earnings calls. The commentary below is AI-generated and then edited by Bespoke for quality control. As always, none of these summaries should be construed as recommendations to buy or sell any securities, and investors should do their own research and/or consult with a financial professional before making any investment decisions.
Our latest recap available to Bespoke subscribers covers PepsiCo’s (PEP) Q3 2025 earnings call.
![]()
PepsiCo (PEP) is a global food and beverage leader whose portfolio includes household staples like Lay’s, Doritos, Cheetos, Quaker, Gatorade, and Pepsi. Operating in more than 200 countries, it serves consumers across retail and foodservice channels. Pepsi’s innovation pipeline, ranging from zero-sugar beverages and functional hydration to protein and fiber-enhanced snacks, puts it at the center of evolving health, affordability, and convenience trends worldwide. The company’s Q3 call focused on regaining volume growth amid affordability pressures and a slower consumer backdrop. Management highlighted a return to balanced price and volume growth, aided by sharper price-pack architecture and innovation across Lay’s, Tostitos, and Gatorade. The company is betting on “better-for-you” offerings like Muscle Milk, Propel for GLP-1 users, and avocado-oil snacks to carry 2026 momentum. Away-from-home sales grew 2–3X retail, while international demand rebounded in September after weather-related softness. Executives also outlined factory and warehouse improvements, Texas “One North America” logistics pilots, and broader AI-driven supply-chain modernization to support margin expansion next year. Shares rose more than 3% in reaction to EPS and revenue beats on 10/9…
Continue reading our Conference Call Recap for PEP by becoming a Bespoke Institutional subscriber. You can sign up for Bespoke Institutional now and receive a 14-day trial to read our newest Conference Call Recap. To sign up, choose either the monthly or annual checkout link below: