Bespoke’s Morning Lineup – 10/23/25 – Stuck in the Middle
See what’s driving market performance around the world in today’s Morning Lineup. Bespoke’s Morning Lineup is the best way to start your trading day. Read it now by starting a two-week trial to Bespoke Premium. CLICK HERE to learn more and start your trial.
“If you want to increase your success rate, double your failure rate.” – Thomas J. Watson, Sr

Below is a snippet of commentary from today’s Morning Lineup. Start a two-week trial to Bespoke Premium to view the full report.
We may be starting to sound like a broken record, but once again this morning, futures are little changed with a downside bias, and the government is still closed. With the Fed in blackout ahead of next week’s rate decision, the only data the market has to focus on domestically is earnings. Overall, the pace of reports continues to come in positively with EPS and sales beat rates in excess of 70%. Also on the subject of broken records, it’s now been eight trading days where the S&P 500 has been stuck within the range it traded in on 10/10.
While the government may be closed, Washington is far from quiet, with the latest news being reports that the Trump Administration is in talks to acquire stakes of up to $10 million in various quantum computing stocks, including IonQ, Rigetti Computing, and D-Wave Quantum. Obviously, these stocks are surging in reaction to the news, and as a result have mostly erased yesterday’s declines. It’s worth pointing out, however, that after the gains these stocks have seen in the last couple of years, their market caps are all at or above $10 billion; a $10 million investment works out to less than 0.1%.
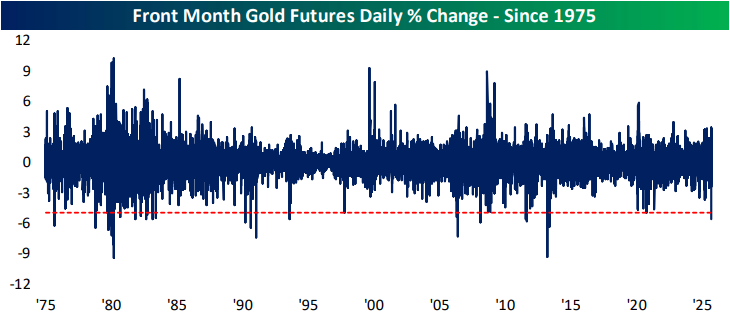
Outside of equities, crude oil is surging 5% and back above $60 per barrel after yesterday’s latest round of sanctions against Russian oil companies. Gold is also trying to regroup after the sell-off from the last couple of days, rallying 1.5% and back above $4,100 per ounce, while silver and platinum are both up at least 2.5%. Even Bitcoin and Ethereum have managed to rally more than 1%.
In international markets, Asian stocks were mixed overnight, with the Nikkei falling 1.4% and the Kospi dropping a percent. Hong Kong (0.7%), China (0.2%), India (0.2%), and Australia (0.1%) all managed to finish higher. The tone in Europe this morning is skewed more positive, with the STOXX 600 rallying 0.3% with little in the way of catalysts besides earnings driving the action.
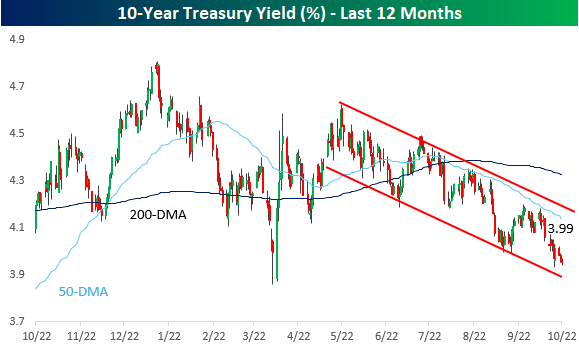
The 10-year yield remains below 4% this morning after trading yesterday at its lowest level since the tariff-tantrum in April. While it wasn’t enough for a 52-week low on an intraday basis, on a closing basis, it was the lowest level since early October of last year. Since peaking at just under 4.6% in May, the 10-year yield has been stuck in a very consistent downtrend channel, and has been moving towards the lower end of that range all month.
The Closer – Rotation, Earnings, Treasury Allotment – 10/22/25
Log-in here if you’re a member with access to the Closer.
Looking for deeper insight into markets? In tonight’s Closer sent to Bespoke Institutional clients, we kick off with a look at the market’s rotation (page 1) followed by a rundown of all the latest earnings including results from Tesla (TSLA), IBM (IBM), and more (pages 2 and 3). We cap off with a look into the latest Treasury auctions (page 4).
See today’s full post-market Closer and everything else Bespoke publishes by starting a 14-day trial to Bespoke Institutional today!
Daily Sector Snapshot — 10/22/25
Chart of the Day – Decent Breadth, No New Highs
B.I.G. Tips – Speculative Stocks Pop
Q3 2025 Earnings Conference Call Recaps: PulteGroup (PHM)
Bespoke’s Conference Call Recaps use AI to summarize lengthy earnings calls. The commentary below is AI-generated and then edited by Bespoke for quality control. As always, none of these summaries should be construed as recommendations to buy or sell any securities, and investors should do their own research and/or consult with a financial professional before making any investment decisions.
Our latest recap available to Bespoke subscribers covers PulteGroup’s (PHM) Q3 2025 earnings call.
![]()
PulteGroup (PHM) is a leading US homebuilder that operates under well-known brands like Pulte Homes, Centex, and Del Webb, delivering thousands of single-family homes annually across 45+ markets. They serve first-time buyers, move-up buyers, and active-adult (55+) communities, offering insight into how large homebuilders navigate affordability, macroeconomic strain, and regional migration. In Q3, the company closed roughly 7,500 homes with home-sale revenue of about $4.2 billion and delivered a 16.8% home-building margin while managing an ROE of about 21%. They noted that buyer demand remains “good, albeit competitive,” but is challenged by weak consumer confidence and stretched affordability, even as interest rates decline. Their active-adult segment grew about 7% in orders, while first-time buyers fell about 14%. They started roughly 6,557 homes and reduced their build cycle to 106 days to manage inventory; spec homes remain near 50% of production, above their 40-45% target, but they’re comfortable with that in the near term. Regionally, Florida and the Southeast showed relative strength, while Texas and the West lagged. On the policy front, they reiterated the US housing shortage (about 3-4 million homes) and flagged a potential $1,500 build-cost headwind per home from tariffs in 2026. They moderated 2025 land spend ($5 billion) but maintain control of about 240,000 lots and noted that easing horizontal development costs (earth-moving/underground) should benefit future lot inflation. On better-than-expected results, PHM shares opened more than 6% lower on 10/21, but recovered the declines by around mid-day…
Continue reading our Conference Call Recap for PHM by becoming a Bespoke Institutional subscriber. You can sign up for Bespoke Institutional now and receive a 14-day trial to read our newest Conference Call Recap. To sign up, choose either the monthly or annual checkout link below:
Q3 2025 Earnings Conference Call Recaps: RTX (RTX)
Bespoke’s Conference Call Recaps use AI to summarize lengthy earnings calls. The commentary below is AI-generated and then edited by Bespoke for quality control. As always, none of these summaries should be construed as recommendations to buy or sell any securities, and investors should do their own research and/or consult with a financial professional before making any investment decisions.
Our latest recap available to Bespoke subscribers covers RTX’s (RTX) Q3 2025 earnings call.
![]()
RTX (RTX), formerly Raytheon Technologies, is one of the world’s largest aerospace and defense companies, formed by the merger of Raytheon and United Technologies. Its three segments (Collins Aerospace, Pratt & Whitney, and Raytheon) span everything from jet engines and avionics to precision missiles and integrated air defense systems. RTX’s technologies power both the world’s most advanced commercial aircraft and critical defense programs like Patriot, AMRAAM, and Stinger. The company serves global airlines, aircraft OEMs, and defense agencies across the US and allied nations, offering an unusually comprehensive view into commercial aviation trends and global defense spending priorities. RTX delivered a strong quarter, with sales up 13% organically. Defense bookings surged as Raytheon’s record $16 billion in new orders drove backlog to $72 billion, 44% international. Commercial aerospace also stayed hot, as resilient global air travel and low aircraft retirements boosted Collins and Pratt & Whitney’s aftermarket sales. Supply chain pressures are easing, with key material output up double digits, while RTX is investing over $600 million in new capacity and deploying AI tools to double missile output. Tariff headwinds (about $90 million per segment) weighed on margins but were offset by pricing strength. Shares were up as much as 11% on 10/21 after reporting the triple play…
Continue reading our Conference Call Recap for RTX by becoming a Bespoke Institutional subscriber. You can sign up for Bespoke Institutional now and receive a 14-day trial to read our newest Conference Call Recap. To sign up, choose either the monthly or annual checkout link below:
Bespoke’s Morning Lineup – 10/22/25 – Mixed Picture
See what’s driving market performance around the world in today’s Morning Lineup. Bespoke’s Morning Lineup is the best way to start your trading day. Read it now by starting a two-week trial to Bespoke Premium. CLICK HERE to learn more and start your trial.
“Women who seek to be equal with men lack ambition” – Timothy Leary
Below is a snippet of commentary from today’s Morning Lineup. Start a two-week trial to Bespoke Premium to view the full report.
The post 10/8 range-bound slog looks set to continue for the S&P 500 today as it enters its eighth day in a row of trading within its intraday range from 10/10. S&P 500 futures are essentially unchanged, while Nasdaq futures point to a modest decline. Yesterday’s weakness in gold and other precious metals has continued this morning, with gold down more than 1%, and while the crypto markets had a positive reversal yesterday, they’re giving it all back today as volatility in that space continues.
Overnight in Asia, most indices saw modest declines, although South Korea managed to buck the trend as it seems nothing can keep the Kospi down. European shares are mixed. The STOXX 600 is trading modestly higher on the session, led higher by the FTSE 100 and Spain’s Ibex 35, while Italy is down 0.5%. This morning’s strength in the UK was catalyzed by a much weaker than expected September CPI report, which showed no change in consumer prices relative to forecasts for an increase of 0.2%.
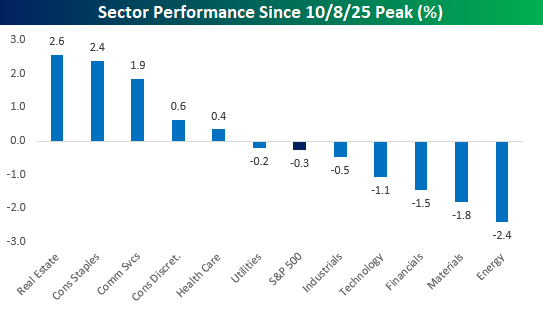
It’s now been two weeks since the S&P 500’s last record high, and while the S&P 500 has seen just marginal declines, some of the moves within sectors have been much larger. As shown in the chart below, Real Estate and Consumer Staples have both rallied over 2% and join Communication Services as the three sectors with gains of over 1%. To the downside, five sectors have declined since the 10/8 high, but four of them are down over 1%, including Energy (-2.4%) and Materials (-1.8%). Technology has also slumped 1.1%, which has acted as the main driver of the index’s decline.
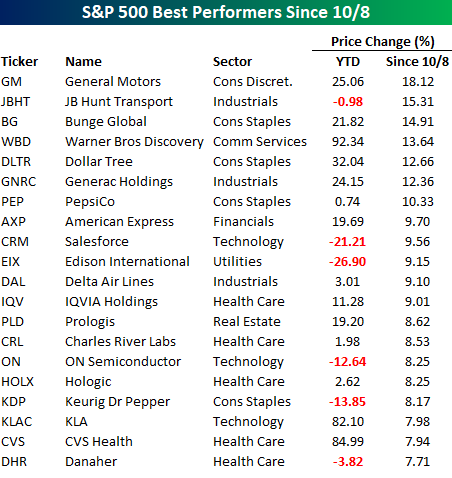
At the individual stock level, it’s been an eclectic mix of winners and losers. Starting with the winners, General Motors (GM) tops the list after yesterday’s post-earnings surge, and it’s one of seven stocks in the S&P 500 that have rallied over 10% since the 10/8 peak. While many of the 20 best-performing stocks in the S&P 500 are handily up YTD, they aren’t exactly the typical winners investors have been used to seeing throughout most of the year. The sector breakdown of these winners further illustrates that trend, as nearly half of the names listed are either from the Health Care (5) or Consumer Staples (4) sectors.
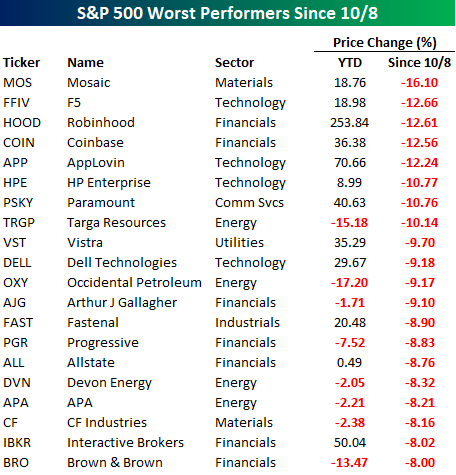
Shifting to the biggest losers, eight stocks in the S&P 500 have seen double-digit percentage declines since the 10/8 peak. Leading the way to the downside, Mosaic (MOS) has declined more than 16%. While many stocks listed have underperformed this year, for stocks like Robinhood (HOOD), Paramount (PSKY), Vistra (VST), Dell (DELL), and Interactive Brokers (IBKR), it has been a pause to potentially refresh.
At the sector level, Financials has been most heavily represented, with over a third of the names listed as concerns in the credit markets have hit some of the names in the sector hard. After Financials, the next most heavily represented sectors are Energy and Technology, with four each.
The Closer – Earnings Review, Gold Gutted, NBFI, 10/21/25
Log-in here if you’re a member with access to the Closer.
Looking for deeper insight into markets? In tonight’s Closer sent to Bespoke Institutional clients, we begin with a recap of all the latest earnings including results from Netflix (NFLX), Capital One (COF), and more (pages 1 and 2). We then dive into the historic decline in gold prices (pages 3 and 4) before turning over to a look into non-bank financial institutions (page 5) and CPI North of the border (page 6).
See today’s full post-market Closer and everything else Bespoke publishes by starting a 14-day trial to Bespoke Institutional today!