Daily Sector Snapshot — 10/27/25
Chart of the Day: Charts at New Highs
Trillion-Dollar Stocks Since ChatGPT
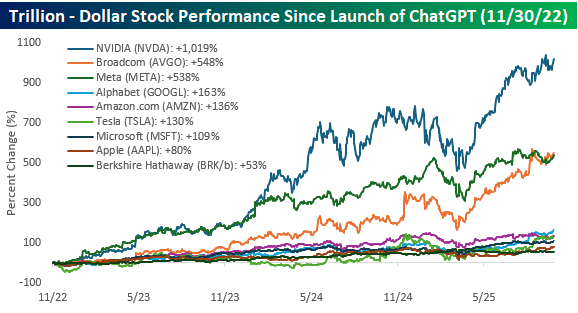
It’s been three days and a month short of three years since the launch of ChatGPT, and companies with any connection to AI have seen their stock prices do well. When ChatGPT first launched, there were four companies with market caps of a trillion or more (Microsoft, Apple, Alphabet, and Amazon.com), but now there are nine, and four of them are in the three-trillion-dollar club!
In the chart below, we show the performance of all nine current trillion-dollar stocks in the S&P 500 since the launch of ChatGPT on 11/30/22. Nvidia (NVDA) has been the obvious leader with a gain of more than 1,000%. When Chat first launched, NVDA’s market cap was less than $420 billion compared to $4.5 trillion now! The next closest stocks in terms of performance – Broadcom (AVGO) and Meta (META) – have barely half the gain of NVDA, but at over 500%, their respective gains have been pretty amazing as well. After these three stocks, though, the gains of the trillion-dollar club look a lot more modest.
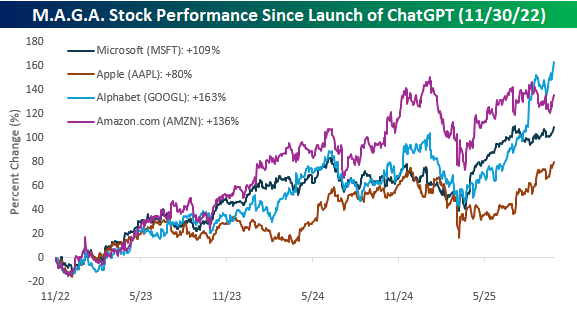
As mentioned above, there were just four trillion-dollar stocks when ChatGPT first launched on 11/30/22, and the performance of the four “M.A.G.A.” stocks, as they were referred to back then, is shown below. When ChatGPT first launched, MSFT was considered one of the biggest winners from AI given its stake in OpenAI, but as the chart above illustrates, its performance hasn’t held a candle to NVDA, AVGO, and even META. Even more surprising, though, has been MSFT’s performance versus the other M.A.G.A. stocks. With a gain of 109%, the only one it’s outperforming is AAPL, which has basically sat AI out.
Early in the AI rally, it was widely assumed that GOOGL had fumbled AI and would forever trail MSFT in the AI arms race. As the chart below illustrates, though, GOOGL’s recent run has put it far ahead of MSFT in terms of performance since the launch of ChatGPT. Whether that leadership continues is an entirely different question, but the fact that GOOGL has taken over in terms of leadership not long after the market crowned MSFT as the AI winner is a market storyline that has played out in different industries and sectors for as long as financial markets have been around. Henry VI said it in another context, but “uneasy lies the head that wears a crown”.

Bespoke’s Morning Lineup – 10/27/25 – Tarnish
See what’s driving market performance around the world in today’s Morning Lineup. Bespoke’s Morning Lineup is the best way to start your trading day. Read it now by starting a two-week trial to Bespoke Premium. CLICK HERE to learn more and start your trial.
“If you could kick the person in the pants responsible for most of your trouble, you wouldn’t sit for a month.” – Theodore Roosevelt

Below is a snippet of commentary from today’s Morning Lineup. Start a two-week trial to Bespoke Premium to view the full report.
A flurry of trade deals announced over the weekend and this morning has futures surging, with the S&P 500 indicated to open up about 0.8% and the Nasdaq indicated to rally more than 1%. It should be noted, however, that current levels are off the overnight highs. With most of the announced deals being connected to Asia, that is where the biggest gains were seen overnight as the Nikkei rallied 2.5% while China gained more than 1%. European stocks have been much more subdued this morning as the STOXX 600 is just marginally higher and major benchmarks on the continent trade on either side of the unchanged line.
With investors taking more of a risk on approach, treasury yields are higher, with the 10-year yield moving back above 4% to 4.03%. Crude oil is fractionally lower along with gold as it tries to recover after breaking a streak of nine weekly gains last week. Finally, after a rough go of it in recent weeks, Bitcoin is up again after a strong weekend, taking it back above $115K while Ethereum is up over $4,100.
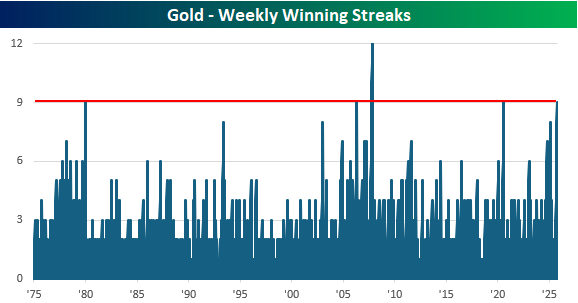
As mentioned above, gold ended a streak of nine straight weekly gains last week during which it rallied more than 25%. Since 1975, it was just the fifth time that gold traded higher for at least nine weeks and the first such streak since August 2020. Of the four prior streaks, only one in 2007 lasted longer (12). Of the four prior streaks, after the first down week that ended the streak, gold continued lower over the following three months three times for a median decline of 4.6%, and a year later it was lower three out of four times as well for a median decline of 7%.
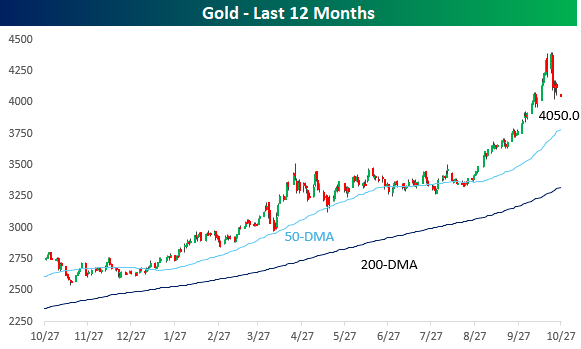
As shown in the chart below, gold’s decline last week was a sharp reversal from record highs hit just last week and was one of the larger drawdowns we have seen in the commodity over the last year. Despite the decline, though, gold remains well above its 50 and 200-DMAs.
Brunch Reads – 10/24/25
Welcome to Bespoke Brunch Reads — a linkfest of some of our favorite articles over the past week. The links are mostly market-related, but there are some other interesting subjects covered as well. We hope you enjoy the food for thought as a supplement to the research we provide you during the week.
Wyatt Earp and His Immortals: On October 26, 1881, in Tombstone, Arizona, the famous gunfight O.K. Corral went down. One of the most famous moments of the American Old West, tensions between lawmen and outlaws reached a boiling point and turned into a deadly, 30-second barrage of gunfire. For months, a feud had grown between brothers Wyatt, Virgil, and Morgan Earp, and a group of local cowboys led by Ike Clanton and Tom McLaury, who were suspected of cattle rustling and stagecoach robberies.
On the afternoon of the 26th, the Earps, joined by Doc Holliday, an unlikely friend of Wyatt’s, confronted the cowboys near the O.K. Corral. The shootout lasted barely 30 seconds, but more than 30 shots were fired. Billy Clanton and both McLaury brothers died. Virgil and Morgan were wounded, and Doc Holliday was grazed on the hip. Wyatt Earp was unscathed.
In the aftermath, public opinion split sharply. Some saw the Earps as heroic lawmen standing up to chaos; others viewed them as ruthless enforcers settling personal grudges. A series of trials and vendettas followed, including the murder of Morgan Earp and the “last charge of Wyatt Earp and his immortals” otherwise known as the Earp vendetta ride, turning the event into the stuff of dime novels and Hollywood legend. Several books and movies exist about the event, but perhaps none are as good as the 1993 movie, Tombstone, starring Kurt Russell as Wyatt Earp and the late Val Kilmer as Doc Holliday. We’re not sure there is any Western film as widely quoted as Tombstone!

Education
The Impact of Cellphone Bans in Schools on Student Outcomes: Evidence from Florida (NBER)
A new study on Florida schools found that banning cellphones initially led to more suspensions, but discipline issues eased after the first year. Test scores and attendance both improved once students adjusted, with fewer unexcused absences explaining much of the academic boost. The positive effects were strongest in middle and high schools where phone use had been highest. [Link]
Continue reading our weekly Brunch Reads linkfest by logging in if you’re already a member or signing up for a trial to one of our two membership levels shown below! You can cancel at any time.

The Bespoke Report – 10/24/25 – Earnings-Driven Breakout
To read our weekly Bespoke Report newsletter and access everything else Bespoke’s research platform offers, start a two-week trial to Bespoke Premium.
U.S. stocks closed the week at fresh record highs, and the S&P hasn’t had even a 3% pullback in the last 180+ days. But what’s in store next as we hit the heart of earnings season next week? Read our latest thoughts in this week’s report.

Daily Sector Snapshot — 10/24/25
Q3 2025 Earnings Conference Call Recaps: Procter & Gamble (PG)
Bespoke’s Conference Call Recaps use AI to summarize lengthy earnings calls. The commentary below is AI-generated and then edited by Bespoke for quality control. As always, none of these summaries should be construed as recommendations to buy or sell any securities, and investors should do their own research and/or consult with a financial professional before making any investment decisions.
Our latest recap available to Bespoke subscribers covers Procter & Gamble’s (PG) Q1 2026 earnings call.
![]()
Procter & Gamble (P&G) is one of the world’s largest consumer goods companies, producing household staples across ten core categories like Fabric Care, Baby Care, Grooming, Oral Care, and Skin & Personal Care. Its iconic brands (Tide, Pampers, Gillette, Olay, and Crest) are used by billions globally and dominate supermarket shelves in over 180 countries. P&G gives investors a read on consumer confidence, pricing power, and retail spending trends across income levels and regions. P&G’s Q1 FY26 call reflected steady results amid a soft global consumption backdrop. Organic sales rose 2% with flat volumes and modest pricing gains, marking the 40th straight quarter of growth. Management highlighted competitive pressure in Fabric and Baby Care, especially in the US and Europe, but pointed to innovations like Tide’s biggest upgrade in 20 years and premium Olay launches in China as key demand drivers. China sales rose 5% while Latin America surged 7%. The company also discussed its restructuring, including cutting up to 7,000 non-manufacturing roles and a $1.5B cost-savings target through “Supply Chain 3.0.” Tariffs remain a $500M headwind, but guidance for 0–4% organic growth was reaffirmed. On better-than-expected results, PG shares were up 3% at the open on 10/24…
Continue reading our Conference Call Recap for PG by becoming a Bespoke Institutional subscriber. You can sign up for Bespoke Institutional now and receive a 14-day trial to read our newest Conference Call Recap. To sign up, choose either the monthly or annual checkout link below:
Q3 2025 Earnings Conference Call Recaps: Intuitive Surgical (ISRG)
Bespoke’s Conference Call Recaps use AI to summarize lengthy earnings calls. The commentary below is AI-generated and then edited by Bespoke for quality control. As always, none of these summaries should be construed as recommendations to buy or sell any securities, and investors should do their own research and/or consult with a financial professional before making any investment decisions.
Our latest recap available to Bespoke subscribers covers Intuitive Surgical’s (ISRG) Q3 2025 earnings call.
![]()
Intuitive Surgical (ISRG) develops and manufactures robotic-assisted surgical systems, most notably the da Vinci and Ion platforms. These systems combine robotics, advanced imaging, and AI to help surgeons perform minimally invasive procedures with greater precision and consistency. The company serves hospitals and healthcare networks globally, with applications spanning general surgery, urology, gynecology, thoracic, and lung biopsy procedures. ISRG’s innovation pipeline, such as its Single-Port (SP) system, force-feedback instrumentation, and AI-powered navigation, makes it a leading barometer for how technology and automation are transforming operating rooms worldwide. ISRG reported another strong quarter as worldwide procedures rose 20% and revenue climbed 23% to $2.5 billion. Adoption of the da Vinci 5 system accelerated, with 240 of 427 placements coming from the newest model. The Ion platform grew 52% in procedures, aided by new FDA-cleared AI imaging features that improved precision in lung diagnostics. SP procedures surged 91%, reflecting early success in new indications. While bariatric volumes softened amid GLP-1 drug use, benign general surgery remained robust. Internationally, growth was broad but tempered by budget pressure in Japan and China. Management highlighted AI integration, digital case insights, and refurbished systems as long-term growth drivers. On better-than-expected results, ISRG rallied 19% after-hours on 10/21…
Continue reading our Conference Call Recap for ISRG by becoming a Bespoke Institutional subscriber. You can sign up for Bespoke Institutional now and receive a 14-day trial to read our newest Conference Call Recap. To sign up, choose either the monthly or annual checkout link below:
Q3 2025 Earnings Conference Call Recaps: Capital One (COF)
Bespoke’s Conference Call Recaps use AI to summarize lengthy earnings calls. The commentary below is AI-generated and then edited by Bespoke for quality control. As always, none of these summaries should be construed as recommendations to buy or sell any securities, and investors should do their own research and/or consult with a financial professional before making any investment decisions.
Our latest recap available to Bespoke subscribers covers Capital One’s (COF) Q3 2025 earnings call.
![]()
Capital One (COF) is one of the largest diversified banks in the United States, offering credit cards, auto loans, retail and digital banking, and commercial financial services. The company has built one of the industry’s most advanced cloud-based platforms, serving over 100 million customers. It serves everyone from mass-market consumers to premium spenders and commercial clients, with its recent acquisition of Discover Financial Services expanding its reach into payment networks and debit processing. Capital One’s third quarter centered on the full-quarter impact of its Discover acquisition, which lifted revenue 23% sequentially. Management reaffirmed $2.5 billion in expected synergies. Consumer credit performance improved despite inflation, tariffs, and high rates, with charge-offs at 4.63% and strong recoveries. Auto losses were 25% lower year over year, while commercial lending remained cautious amid private credit expansion. CEO Richard Fairbank emphasized Capital One’s long-running tech transformation and AI integration, as well as continued investment in premium cards like Venture X to win higher-spending customers. COF shares opened almost 4% higher on 10/22 in reaction to stronger-than-expected results…
Continue reading our Conference Call Recap for COF by becoming a Bespoke Institutional subscriber. You can sign up for Bespoke Institutional now and receive a 14-day trial to read our newest Conference Call Recap. To sign up, choose either the monthly or annual checkout link below: