Q3 2025 Earnings Conference Call Recaps: Microsoft (MSFT)
Bespoke’s Conference Call Recaps use AI to summarize lengthy earnings calls. The commentary below is AI-generated and then edited by Bespoke for quality control. As always, none of these summaries should be construed as recommendations to buy or sell any securities, and investors should do their own research and/or consult with a financial professional before making any investment decisions.
Our latest recap available to Bespoke subscribers covers Microsoft’s (MSFT) Q1 2026 earnings call.
![]()
Microsoft (MSFT) software, hardware, and cloud services power the backbone of modern digital life. Its portfolio spans operating systems (Windows), productivity software (Microsoft 365), developer tools (GitHub, Visual Studio), cloud infrastructure (Azure), AI platforms, and gaming (Xbox). The company serves consumers, enterprises, and governments worldwide. Microsoft reported a strong start to fiscal 2026, with revenue up 18% to $77.7 billion and cloud revenue climbing 26% to $49 billion. The company highlighted massive AI infrastructure expansion (AI capacity up 80% this year and total data center footprint set to double in two years), driven by surging demand from partners like OpenAI, which added $250 billion in Azure commitments. Microsoft 365 Copilot adoption exceeded 150 million users, while GitHub Copilot reached 26 million. Fabric data platform revenue rose 60%, and security saw 100 trillion daily signals processed. Despite Azure capacity constraints, management emphasized strong bookings and durable AI-driven growth. MSFT shares fell 2.9% on 10/30 despite better-than-expected results…
Continue reading our Conference Call Recap for MSFT by becoming a Bespoke Institutional subscriber. You can sign up for Bespoke Institutional now and receive a 14-day trial to read our newest Conference Call Recap. To sign up, choose either the monthly or annual checkout link below:
Q3 2025 Earnings Conference Call Recaps: Meta Platforms (META)
Bespoke’s Conference Call Recaps use AI to summarize lengthy earnings calls. The commentary below is AI-generated and then edited by Bespoke for quality control. As always, none of these summaries should be construed as recommendations to buy or sell any securities, and investors should do their own research and/or consult with a financial professional before making any investment decisions.
Our latest recap available to Bespoke subscribers covers Meta’s (META) Q3 2025 earnings call.
![]()
Meta Platforms (META), the owner of social media platforms like Facebook, Instagram, WhatsApp, and Messenger, connects more than 3 billion people daily. The company generates nearly all its revenue from advertising through AI systems that personalize content and optimize ad performance across its apps. Beyond social media, Meta is aggressively investing in AI infrastructure and hardware, developing frontier models, wearable devices like Ray-Ban Meta glasses, and long-term AR/VR projects such as Quest and Orion. Meta’s quarter highlighted record engagement and expanding AI capabilities. Time spent on Facebook rose 5%, Threads 10%, and Instagram video viewing jumped 30%, while Reels hit a $50 billion annual run rate. Advertising performance improved as Advantage+ automation and Lattice models drove higher conversions and lower costs per lead. Meta also expanded its business AIs in Mexico and the Philippines and reported 60% YoY growth in click-to-WhatsApp ads. Hardware demand surged as the new Ray-Ban and Oakley Meta glasses sold out within 48 hours. Management emphasized front-loading compute capacity for superintelligence development and flagged regulatory risks in the EU and US as potential near-term headwinds. The stock fell 11.3% on 10/30 despite EPS and revenue beats as huge AI investments weighed on the stock…
Continue reading our Conference Call Recap for META by becoming a Bespoke Institutional subscriber. You can sign up for Bespoke Institutional now and receive a 14-day trial to read our newest Conference Call Recap. To sign up, choose either the monthly or annual checkout link below:
Bespoke Market Calendar — November 2025
Please click the image below to view our November 2025 market calendar. This calendar includes the S&P 500’s historical average percentage change and average intraday chart pattern for each trading day during the upcoming month. It also includes market holidays and options expiration dates plus the dates of key economic indicator releases.
Note: Due to the government shutdown, scheduled release dates are subject to change. Click here to view Bespoke’s premium membership options.
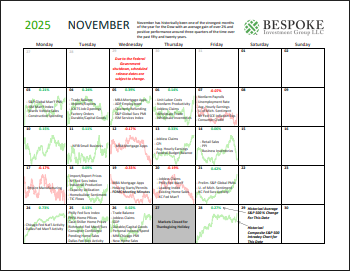
As a result of the government shutdown, in addition to the usual monthly calendar below we show a running list of releases that have been delayed since the shutdown began. Thus far, the only data point to have released after missing its original release date has been been CPI.
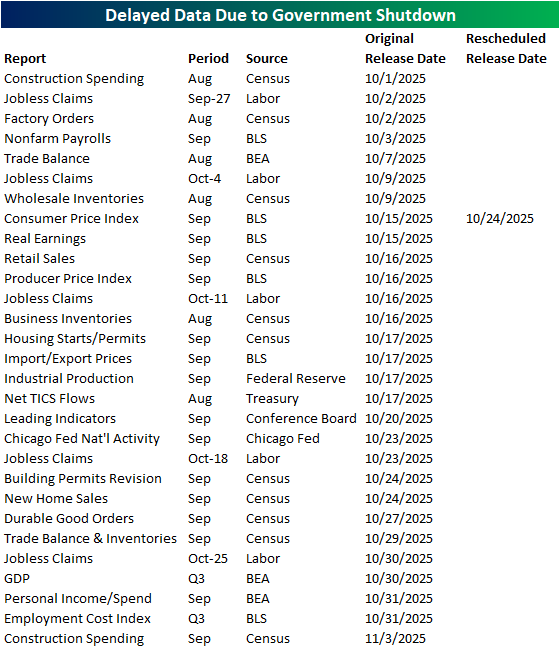
Chart of the Day: It’s the Most…Wonderful Time…of the Year
Bespoke’s Morning Lineup – 11/3/25 – Nine’s Fine
See what’s driving market performance around the world in today’s Morning Lineup. Bespoke’s Morning Lineup is the best way to start your trading day. Read it now by starting a two-week trial to Bespoke Premium. CLICK HERE to learn more and start your trial.
“It would be a mistake to think something is wonderful just because it looks great.” – Anna Wintour

Below is a snippet of commentary from today’s Morning Lineup. Start a two-week trial to Bespoke Premium to view the full report.
Last week may have been the peak week of earnings season in terms of the market cap of companies reporting, but we have another busy week in store for investors, and it’s picking up right where it left off last week. Of the companies reporting so far today, 89% have reported better than expected EPS forecasts, and 75% have topped sales forecasts, so you can’t ask for much more than that. Even in terms of guidance, 3 companies have raised forecasts while only one lowered.
In response to the better-than-expected reports, equity futures are also picking up right where they left off last week, as markets look to open the week higher with the Nasdaq leading the way. Today’s positive open for the Nasdaq will be the ninth straight positive start to a week for the index, which is only the longest streak since summer 2024, but still tied for the second longest in the index’s history.
In Asia, Japan was closed for the day, but other indices in the region were broadly higher even as South Korea’s manufacturing PMI moved into contraction territory. In Europe, most manufacturing PMIs were also in line with forecasts, and the STOXX 600 responded by rallying 0.5% while Germany rallied more than 1%.
Outside of equities, the 10-year yield is slightly lower at 4.09% ahead of a busy week for Fed speakers, who have mostly sounded more skeptical of a December rate cut, as concerns over inflation linger even as there are signs that the labor market is stabilizing.
Crude oil prices are essentially unchanged even as OPEC+ announced over the weekend that it would increase output by 137K barrels per day, but then pause those increases beginning in January. WTI is starting the month just over $60 per barrel after declining 2% in October, taking its monthly losing streak to three months.
Gold prices are starting off the month back above $4,000 per ounce as other metals also trade higher, but the troubles for digital gold continue as bitcoin prices trade down close to 2% and barely hangs on to $108K. Ethereum prices are down twice as much as they barely hang on to $3,700.
With just two months left in the year, over the weekend, we looked at asset class performance, country performance, and individual stock performance for October and various other time periods. Make sure to take a look at that rundown of where things stand heading into year-end. Even though the major averages may be looking good, not everything looks great.
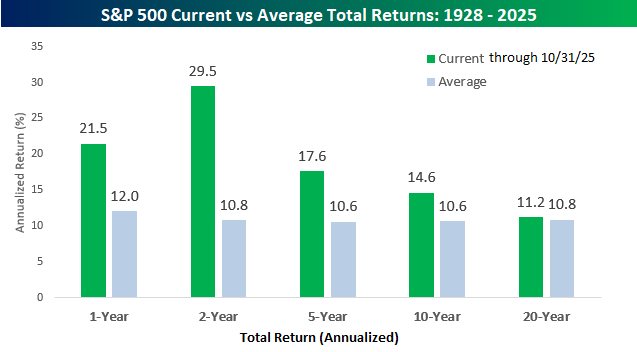
Taking a high-level look at equity market returns, whether you’re looking at the short-term or long-term, it has been a friendly environment. Over the last year, the S&P 500’s total return has been a gain of 21.5% which is nearly twice the historical average of 12.0%, but over the last two years, the 29.5% annualized gain has been nearly triple the long-term average. Looking out over longer-term time periods, though, over the last five, ten, and twenty years, returns aren’t as strong, but they’re still above the long-term average.
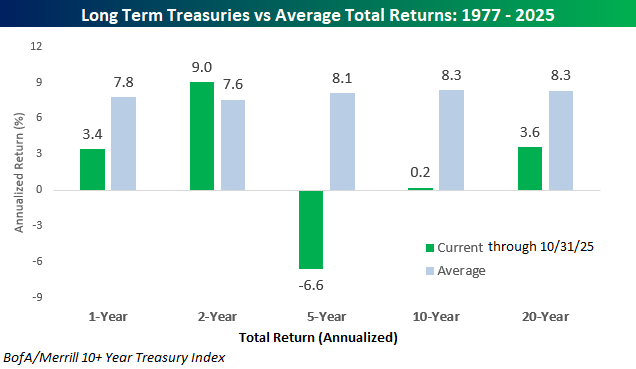
While equity market investors have been on a highway paved in green, the treasury market has been a world of pain. Over the last year, long-term treasuries, as measured by the BofA/Merrill 10+ Year Treasury Index, have posted positive returns, but at 3.4% it’s still less than half of the long-term average. Over the last two years, the annualized gain of 9.0% is actually slightly above average. Still, looking back further than that, it’s been a painful five, ten and twenty years for anyone who has loaned money to the US Treasury.
Best and Worst Stocks and ETFs Through October
With just two months left in the year, it’s time to update our asset class performance matrix and highlight the best and worst performing stocks year-to-date.
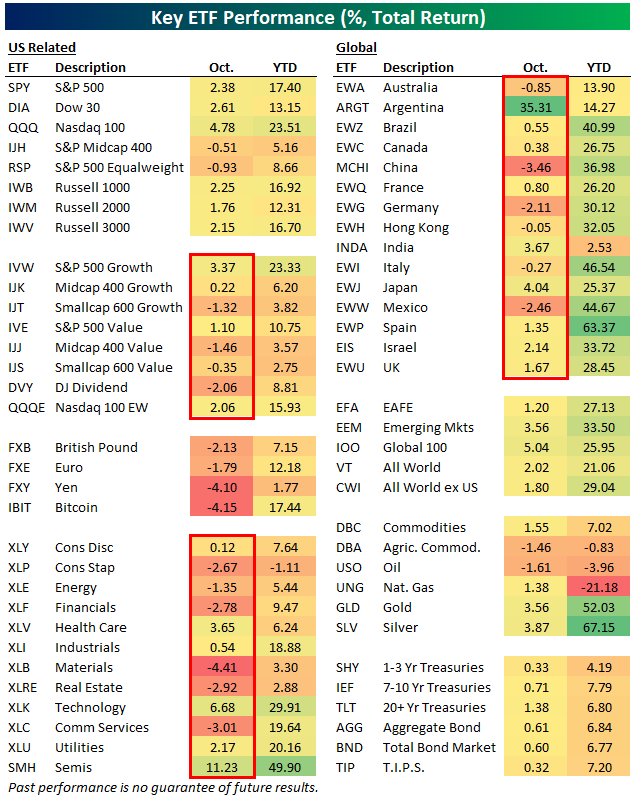
Below is a look at total returns across a range of ETFs both year-to-date and during the month of October.
October was a month dominated by the mega-caps, as they pushed large-cap ETFs like SPY, DIA, and QQQ solidly green, while the equal-weight ETF (RSP) and mid-caps actually fell. Small-cap growth (IJT) and value (IJS) were also red, along with the Dow Jones Dividend ETF (DVY).
Across sectors, more fell in October (6) than rose (5), with Technology (XLK) and Health Care (XLV) the only two big areas of strength.
Outside the US, Argentina (ARGT) rose 35% in October after President Milei’s party maintained control in elections. China (MCHI), Germany (EWG), and Mexico (EWW) were the three worst country ETFs in our matrix during October.
On a year-to-date basis, large-cap domestic ETFs are sitting on solid gains of 15-20%, and the Semis ETF (SMH) is up a whopping 49.9%. Silver (SLV), gold (GLD), and Spain (EWP) are the three best performers in the entire matrix so far in 2025 with 50%+ returns.
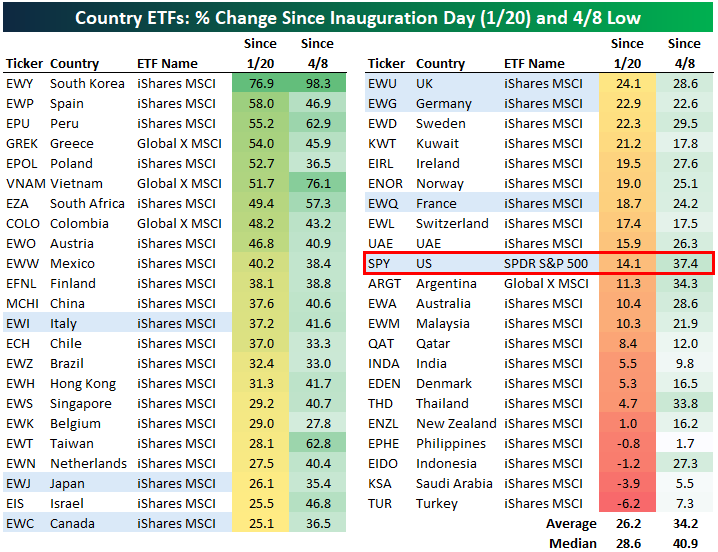
Below is an updated look at performance across a more expansive list of country ETFs since President Trump’s 2nd term began as well as since the “tariff tantrum” lows on April 8th.
The average country ETF is up 34.2% since 4/8 and 26.2% since Trump’s Inauguration on 1/20. The US (SPY) is slightly outperforming since the 4/8 low, but it’s underperforming since Inauguration Day with a gain of 14.1%.
South Korea (EWY), Spain (EWP), Peru (EPU), Greece (GREK), Poland (EPOL), and Vietnam (VNAM) have been the best performers since Trump’s 2nd term began with gains of more than 50%.
There are just four country ETFs in the red since Inauguration Day (Philippines – EPHE, Indonesia – EIDO, Saudi Arabia – KSA, and Turkey – TUR), and every single country ETF is positive since the tariff tantrum low on 4/8.
The average stock in the large-cap Russell 1,000 is up 9% year-to-date even though it fell 1% in October.
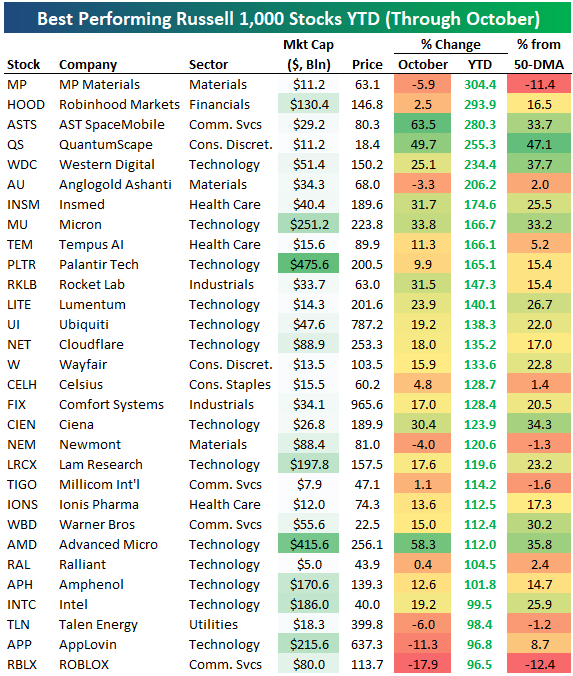
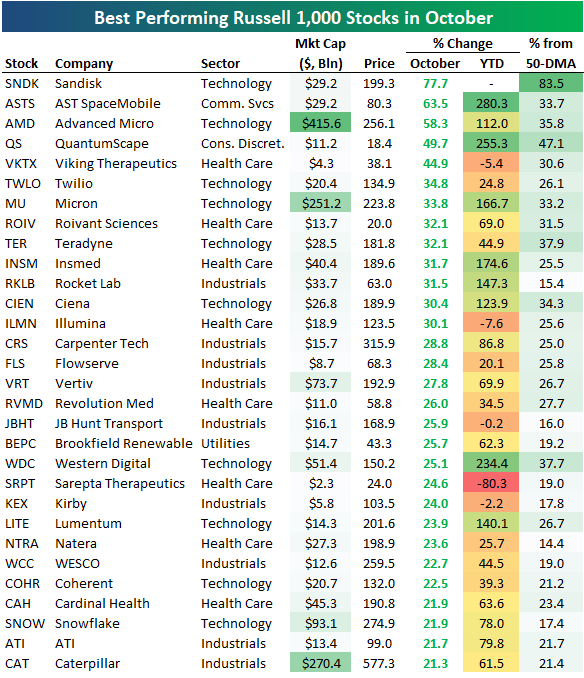
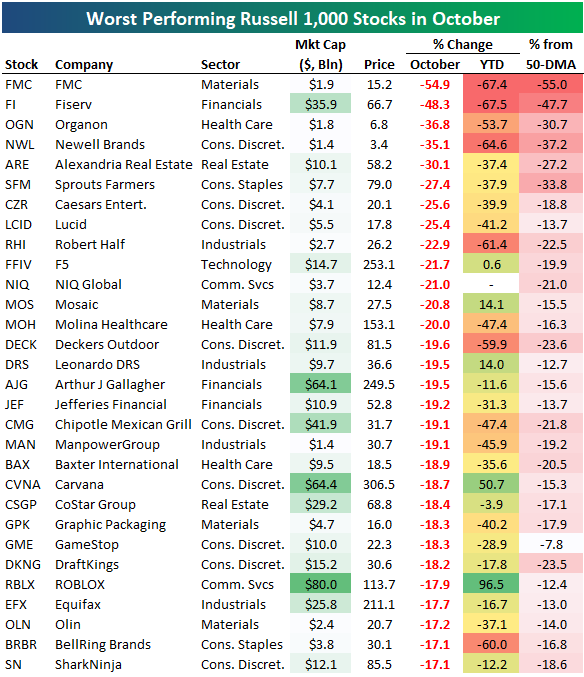
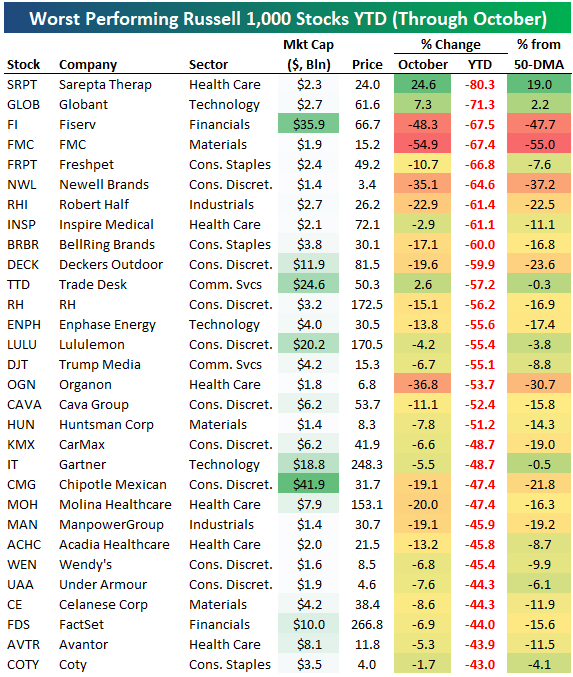
The tables below show the 30 best and worst performing stocks in the index both year-to-date and in October.
There are 26 stocks in the index up more than 100% year-to-date, along with six that are up 200%, and one that’s up 300%. MP Materials (MP) ranks first with a YTD gain of 304.4%, followed by Robinhood (HOOD), AST SpaceMobile (ASTS), QuantumSpace (QS), and Western Digital (WDC).
Other notables on the list of 100%+ gainers this year include Micron (MU), Palantir (PLTR), Cloudflare (NET), Wayfair (W), Celsius (CELH), Warner Bros (WBD), Advanced Micro (AMD), Intel (INTC), AppLovin (APP), and ROBLOX (RBLX).
In October, Sandisk (SNDK) was up the most with a gain of nearly 78%, followed by AST SpaceMobile (ASTS) and Advanced Micro (AMD). Other notable winners in October include Twilio (TWLO), Rocket Lab (RKLB), Ciena (CIEN), Vertiv (VRT), JB Hunt (JBHT), Natera (NTRA), and Caterpillar (CAT).
On the flip side, FMC was the worst performing Russell 1,000 stock in October with a decline of 54.9%. Fiserv (FI), Organon (OGN), and Newell Brands (NWL) each fell more than 35% as well.
Some of the biggest names on the list of October losers include Chipotle (CMG), Carvana (CVNA), and ROBLOX (RBLX). RBLX is on the list of October’s biggest losers even though it’s also on the list of 2025’s biggest winners.
Even though it has been a strong year for major cap-weighted US indices, 44.4% of stocks in the Russell 1,000 are in the red on the year. Below are the year’s biggest decliners thus far. W
You won’t find many “AI” names on this list…
Not a Bespoke client? We’d love for you to give our equity research platform, Bespoke Premium, a try. You can sign up for complimentary access for 14 days at this link to start receiving our daily emails today!

Brunch Reads – 11/2/25
Welcome to Bespoke Brunch Reads — a linkfest of some of our favorite articles over the past week. The links are mostly market-related, but there are some other interesting subjects covered as well. We hope you enjoy the food for thought as a supplement to the research we provide you during the week.
Home Sweet Space Station: On November 2, 2000, the first resident crew arrived at the International Space Station (ISS). Known as Expedition 1, the team consisted of American astronaut William Shepherd and Russian cosmonauts Sergei Krikalev and Yuri Gidzenko. Their arrival was the beginning of a continuous human presence aboard the orbiting laboratory, which has now lasted for decades.
Launched from Kazakhstan aboard a Russian Soyuz spacecraft, the trio docked with the ISS just two weeks after its final pre-crew construction phase. The station was still in its infancy, with just three modules connected together, and basic life-support systems and minimal equipment. The crew spent four and a half months in orbit, getting systems up and running, unpacking supplies from unmanned cargo ships, and preparing the station for the future.
Expedition 1 was a post–Cold War collaboration between the United States and Russia in space exploration. It paved the way for over 200 astronauts and cosmonauts from around the world to live and work aboard the ISS. What began as a small outpost for three men has evolved into one of the most remarkable international scientific partnerships in history, a testament to cooperation beyond borders, orbiting 250 miles above Earth.

Culture & Population Trends
The LL game: the curious preference for low quality and its norms (Sage Journals)
In some Italian institutions, mediocrity can become a social norm, where low-quality work isn’t just tolerated but expected. Those who try to deliver higher quality often face pushback because it disrupts the accepted balance. The study suggests that this creates a stable culture of mediocrity that resists improvement. [Link]
Continue reading our weekly Brunch Reads linkfest by logging in if you’re already a member or signing up for a trial to one of our two membership levels shown below! You can cancel at any time.

The Bespoke Report – Quarterly Macro Update – 10/31/25
To read our weekly Bespoke Report newsletter and access everything else Bespoke’s research platform offers, start a two-week trial to Bespoke Premium. This week we are publishing our quarterly review of global financial markets from a macro perspective, touching on the AI boom and the debt underpinning it, the US economic and Federal Reserve outlook, and snapshots of the Eurozone, Germany, Sweden, South Korea, and China.

Daily Sector Snapshot — 10/31/25
Q3 2025 Earnings Conference Call Recaps: Visa (V)
Bespoke’s Conference Call Recaps use AI to summarize lengthy earnings calls. The commentary below is AI-generated and then edited by Bespoke for quality control. As always, none of these summaries should be construed as recommendations to buy or sell any securities, and investors should do their own research and/or consult with a financial professional before making any investment decisions.
Our latest recap available to Bespoke subscribers covers Visa’s (V) Q4 2025 earnings call.
![]()
Visa (V) operates the world’s largest electronic payments network, connecting more than 4 billion cards, bank accounts, and digital wallets through roughly 12 billion endpoints. The company doesn’t issue cards or extend credit but provides the infrastructure that enables global commerce, handling $14 trillion in payments volume in fiscal 2025. Visa’s fiscal Q4 results showed steady consumer resilience despite global uncertainty. Payments volume rose 9% YoY, cross-border transactions climbed 11%, and value-added services revenue jumped 25%. Management emphasized growth in agentic commerce (AI-powered shopping experiences) and accelerating use of stablecoins for settlement and cross-border money movement. Tokenized transactions now exceed 16 billion, and Visa is enabling banks to mint and burn stablecoins. Tap-to-pay reached 79% of global face-to-face transactions, while Visa Direct volumes surged 27%. CEO Ryan McInerney called Visa a “hyperscaler” for the payments ecosystem, integrating AI across all operations heading into a year boosted by the Olympics and FIFA World Cup. Shares fell 1.8% on 10/29 despite EPS and revenue beats…
Continue reading our Conference Call Recap for V by becoming a Bespoke Institutional subscriber. You can sign up for Bespoke Institutional now and receive a 14-day trial to read our newest Conference Call Recap. To sign up, choose either the monthly or annual checkout link below: