Bespoke’s Morning Lineup – 11/7/25
See what’s driving market performance around the world in today’s Morning Lineup. Bespoke’s Morning Lineup is the best way to start your trading day. Read it now by starting a two-week trial to Bespoke Premium. CLICK HERE to learn more and start your trial.
“There is a crack in everything, that’s how the light gets in.” – Leonard Cohen

Below is a snippet of commentary from today’s Morning Lineup. Start a two-week trial to Bespoke Premium to view the full report.
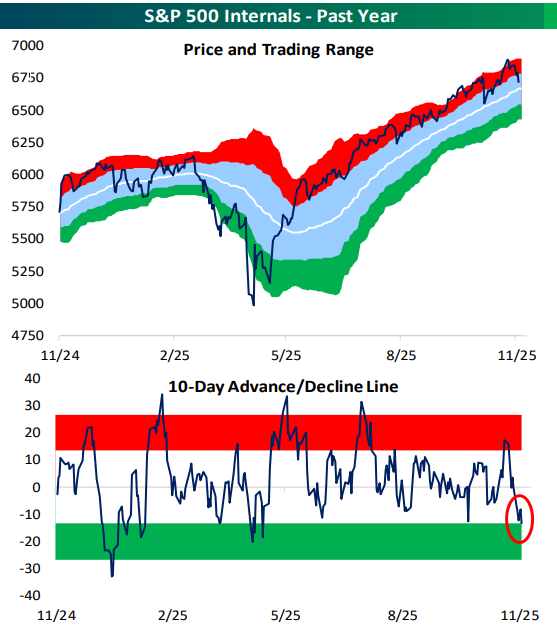
While the S&P 500’s price remains above its 50-day moving average (for now at least), its 10-day advance/decline line has moved into oversold territory for the first time since the April tariff tantrum. This is indicative of an oversold market in the short-term, even though price looks neutral on the surface.
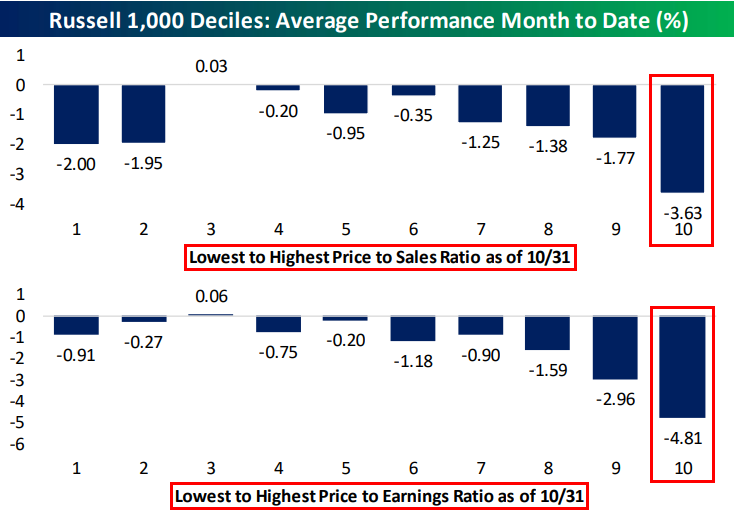
Futures are trading lower once again this morning as the bears have taken control. So far this month, the year’s biggest winners have been hit the hardest, but those are also the names with the most lofty valuations. Below are decile charts showing the performance of Russell 1,000 stocks month-to-date based on price-to-sales and price-to-earnings ratios. Decile 10 in each chart contains the stocks with the highest of these two valuation metrics. Stocks in the decile that contains the highest price-to-sales ratios are down an average of 3.6% this month, while stocks in the decile that includes the highest P/E ratios are down 4.8%. Other deciles aren’t down nearly as much.
The Closer – Implementation Implodes, Fedspeak, Claims – 11/6/25
Log-in here if you’re a member with access to the Closer.
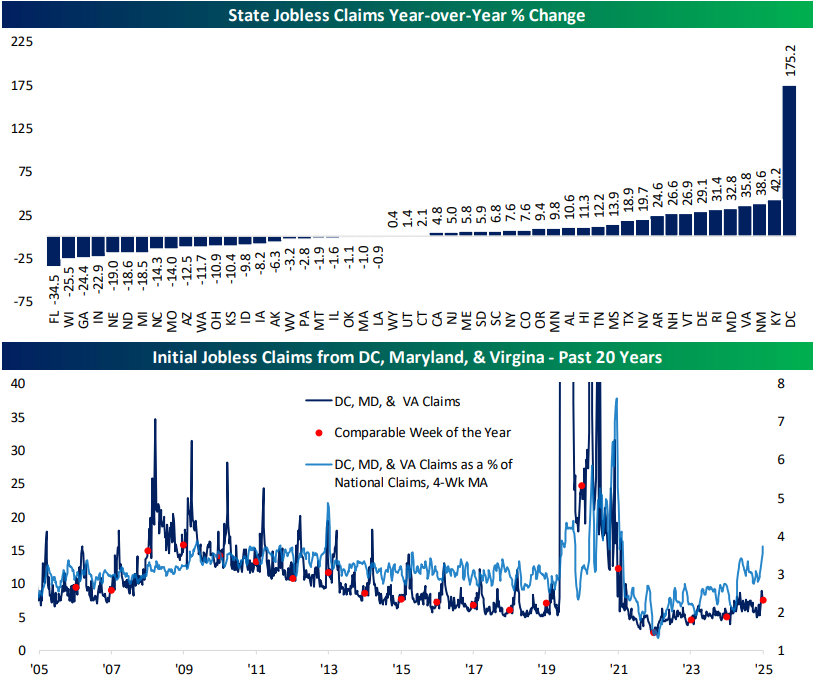
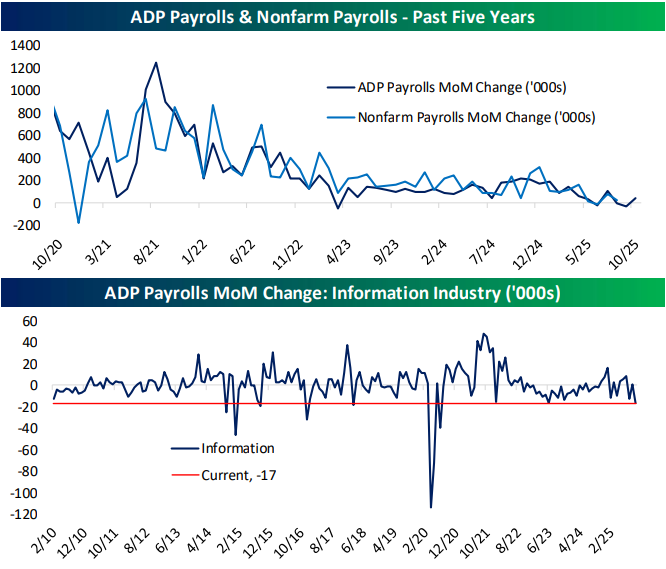
Looking for deeper insight into markets? In tonight’s Closer sent to Bespoke Institutional clients, we lead off with a look into the weak month to date performance at the tail ends of the valuation, revenue growth, and year to date performance spectrums (page 1). We follow up with a check in on the lagging performance of AI Implementation stocks (page 2) before pivoting into a rundown of tonight’s earnings and a busy day of Fedspeak (page 3). We finish with a look at state level jobless claims data (page 4).
See today’s full post-market Closer and everything else Bespoke publishes by starting a 14-day trial to Bespoke Institutional today!
Bespoke’s Weekly Sector Snapshot — 11/6/25
Chart of the Day: Bears Take Control
Bespoke’s Morning Lineup – 11/6/25
See what’s driving market performance around the world in today’s Morning Lineup. Bespoke’s Morning Lineup is the best way to start your trading day. Read it now by starting a two-week trial to Bespoke Premium. CLICK HERE to learn more and start your trial.
“The problem with socialism is that you eventually run out of other peoples’ money.” – Margaret Thatcher
Below is a snippet of commentary from today’s Morning Lineup. Start a two-week trial to Bespoke Premium to view the full report.
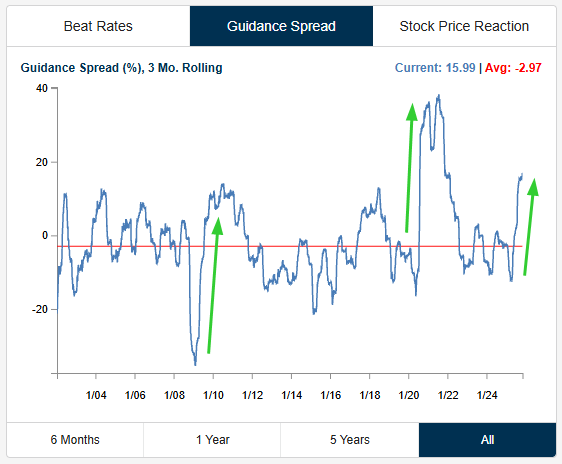
We’re now in the back half of the Q3 earnings season, and probably the most consequential data point we’re seeing coming out of this season is continued strength in forward guidance.
Last earnings season was the first one following the tariff tantrum of the spring, and investors were pleasantly surprised that more companies raised guidance than lowered guidance. That trend has continued in a big way this season, and with more than 1,000 companies reporting Q3 numbers thus far, we’ve seen 14% raise guidance compared to just 6% that have lowered guidance. As shown below, our guidance spread chart, which shows the percentage of companies raising minus lowering guidance on a rolling three-month basis, has spiked to a level we’ve only seen once before, which was the period coming out of the COVID Crash in 2020. These big spikes in guidance have historically happened in the early part of periods following max uncertainty.
The Closer – Risk Slump, Layoff Announcements, PMIs – 11/5/25
Log-in here if you’re a member with access to the Closer.
Looking for deeper insight into markets? In tonight’s Closer sent to Bespoke Institutional clients, we begin with a look at the latest earnings including a check in on performance of consumer risk sentiment stocks (page 1). We then review the latest labor data (page 2) and service PMIs (page 3) before closing out with a rundown of petroleum inventories (page 4).
See today’s full post-market Closer and everything else Bespoke publishes by starting a 14-day trial to Bespoke Institutional today!
Daily Sector Snapshot — 11/5/25
Chart of the Day – One Year Since the Presidential Election
The “Kingda Ka” of Stocks
When it comes to whatever area of the technology sector is popular, it’s usually safe to assume that Japanese billionaire Masayoshi Son’s investment holding company SoftBank is active in it. The company always rides the wave when certain tech sectors get hot, but it’s usually along for the ride as the wave crests and starts to roll over. The last several weeks provide an excellent example.
From the April low through its recent intraday high a week ago today, shares of SoftBank rallied more than 380% in the span of just over six months! However, as investors start to question the valuations of AI-related stocks and cryptocurrencies, the stock has quickly corrected. Shares kicked off the week on Tuesday (Monday was a holiday in Japan) by declining 7% and followed that up with an even larger encore overnight, falling more than 10% today. On both a one-day and two-day basis, the declines rank as the steepest since the April lows.
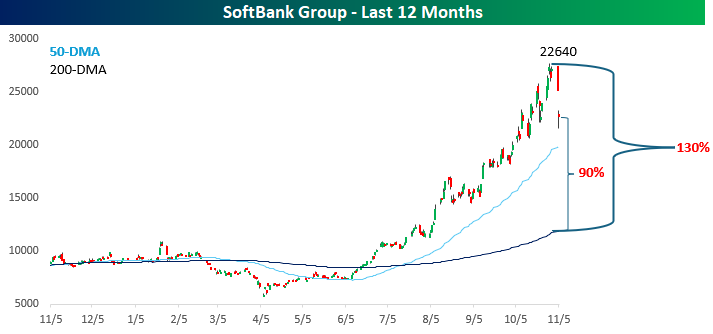
What’s bananas about SoftBank, though, is that even after the declines in the last two days, the stock is still 90% above its 200-day moving average (DMA)! Robinhood (HOOD), the best performing stock in the S&P 500 this year, is ‘only’ 65% above its 200-DMA, so 90%, let alone the 130% that SoftBank was trading above its 200-DMA last week, is incredible.
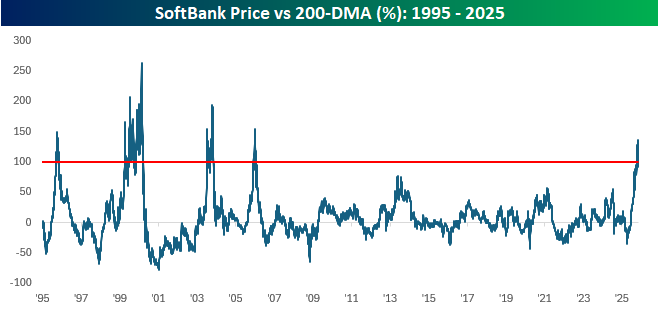
Relative to its own history, SoftBank’s recent peak of trading 130% above its 200-DMA was the widest spread since December 2005, when its 200-DMA spread reached 154%. Believe it or not, that wasn’t even the stock’s peak. In 2003, the spread reached 190%, and at the height of the dot-com bubble, the spread surged to 262%, or double what the spread just recently peaked at. Double! When it comes to investing, most advisors suggest that slow and steady wins the race, but Masayoshi Son has shown that there are other ways to get from here to there.
Not a Bespoke client? We’d love for you to give our equity research platform, Bespoke Premium, a try. You can sign up for complimentary access for 14 days at this link to start receiving our daily emails today!

Bespoke’s Morning Lineup – 11/5/25
See what’s driving market performance around the world in today’s Morning Lineup. Bespoke’s Morning Lineup is the best way to start your trading day. Read it now by starting a two-week trial to Bespoke Premium. CLICK HERE to learn more and start your trial.
“When it is darkest there is always light ahead.” – Roald Amundsen
Below is a snippet of commentary from today’s Morning Lineup. Start a two-week trial to Bespoke Premium to view the full report.
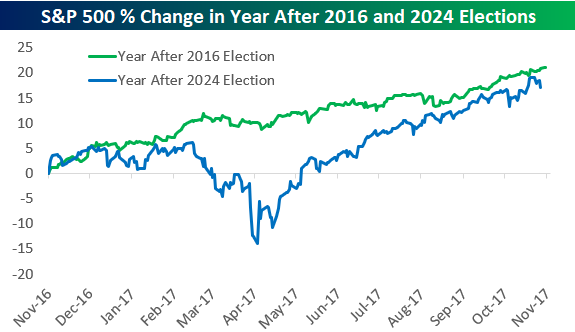
While New York City elected a democratic socialist to be its next mayor last night, today is the first anniversary of the 2024 Presidential Election. Below is a look at the S&P 500’s percentage change over the last year compared to its change in the year after President Trump’s first election victory in 2016. While the two paths diverge in the middle part of the chart because of the “tariff tantrum” seen earlier this year, the full-year performance for the S&P following the 2016 and 2024 Elections is now very similar. We’ll be looking at stock market performance during the Presidential Election Cycle in more detail in today’s Chart of the Day, so keep an eye out for that if you have an interest.
Below is our asset class performance matrix showing total returns across a range of ETFs in the year after the 2024 Election versus the year after the 2016 Election.
While large-cap domestic equity ETFs posted strong gains in the first year after Trump’s 2016 and 2024 wins, there are a lot of areas that have done a lot worse this time around.
The biggest disparities show up in small and mid-cap ETFs. In the year after the 2016 Election, we saw similar 20%+ gains across the market-cap spectrum. This time around, small-caps and mid-caps have been left in the dust, while large-caps have surged.
As an example, the S&P 500 Growth ETF (IVW) is up 27.8% since last year’s Election, while the Smallcap 600 Growth ETF (IJT) is up just 0.55%.
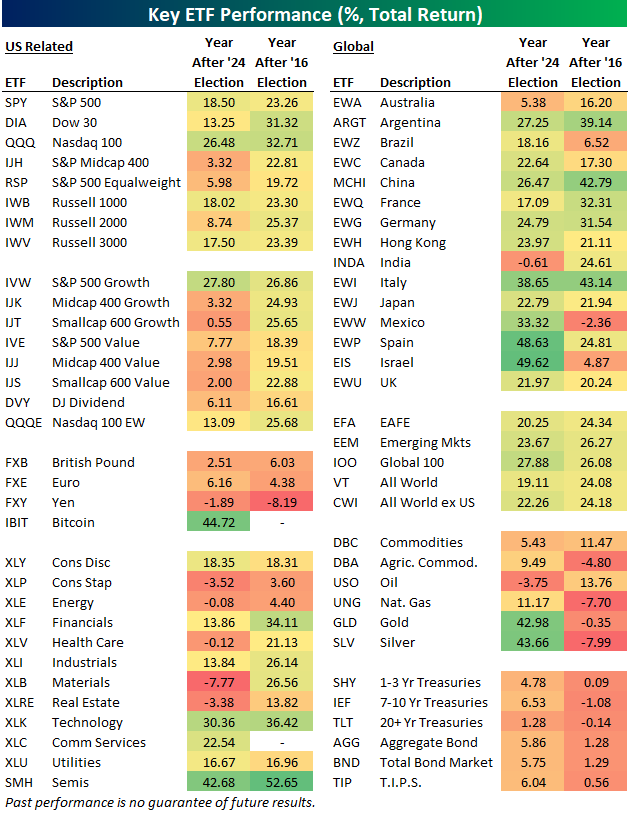
Looking at sector ETFs, Technology (XLK) and Consumer Discretionary (XLY) were up similar amounts, but Health Care (XLV), Materials (XLB), and Real Estate (XLRE) have been much weaker in the last year compared to the year after the 2016 Election.
Outside of the US, we’ve seen most country ETFs post huge gains since the 2024 Election, while their returns were much more muted in the year after the 2016 Election.
Finally, gold (GLD) and silver (SLV) have been two of the best performing ETFs in the entire matrix since Trump’s 2024 victory, but they were down in the year after his first victory.