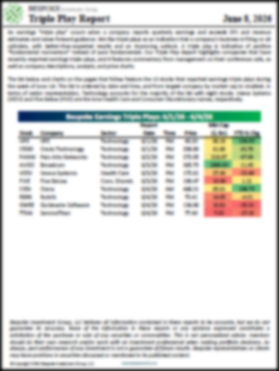
The Triple Play Report: 6/8/26
An earnings triple play is a stock that reports earnings and manages to 1) beat analyst EPS estimates, 2) beat analyst sales estimates, and 3) raise forward guidance. You can read more about “triple plays” at Investopedia.com where they’ve given Bespoke credit for popularizing the term. We like triple plays as an indication that a company’s business is firing on all cylinders, with better-than-expected results and an improving outlook. A triple play is indicative of positive “fundamental momentum” instead of pure fundamentals, and there are always plenty of names with both high and low valuations on our quarterly list.
Bespoke’s Triple Play Report covers what each company does, what this quarter’s results say about their growth outlooks, and their histories of delivering triple plays. Bespoke’s Triple Play Report is available at the Bespoke Institutional level only. You can sign up for Bespoke Institutional now and receive a 14-day trial to read today’s Triple Play Report. To sign up, choose either the monthly or annual checkout link below:
Bespoke Institutional – Monthly Payment Plan
Bespoke Institutional – Annual Payment Plan
Bespoke Investment Group, LLC believes all information contained in these reports to be accurate, but we do not guarantee its accuracy. None of the information in these reports or any opinions expressed constitutes a solicitation of the purchase or sale of any securities or commodities. This is not personalized advice. Investors should do their own research and/or work with an investment professional when making portfolio decisions. As always, past performance of any investment is not a guarantee of future results. Bespoke representatives or clients may have positions in securities discussed or mentioned in its published content.
Chart of the Day – AI Unwind Last Week; Friday 4%+ Drops
Bespoke’s Morning Lineup – 6/8/26 – Assessing the Damage
See what’s driving market performance around the world in today’s Morning Lineup. Bespoke’s Morning Lineup is the best way to start your trading day. Read it now by starting a two-week trial to Bespoke Premium. CLICK HERE to learn more and start your trial.
“It takes less courage to criticize the decisions of others than to stand by your own.” – Attila the Hun (attributed)

Below is a snippet of commentary from today’s Morning Lineup. Start a two-week trial to Bespoke Premium to view the full report.
US equity futures are bouncing back to start the new trading week with the S&P 500 trading up roughly 0.7% pre-market, and the Tech-heavy Nasdaq 100 up about 1.3%.
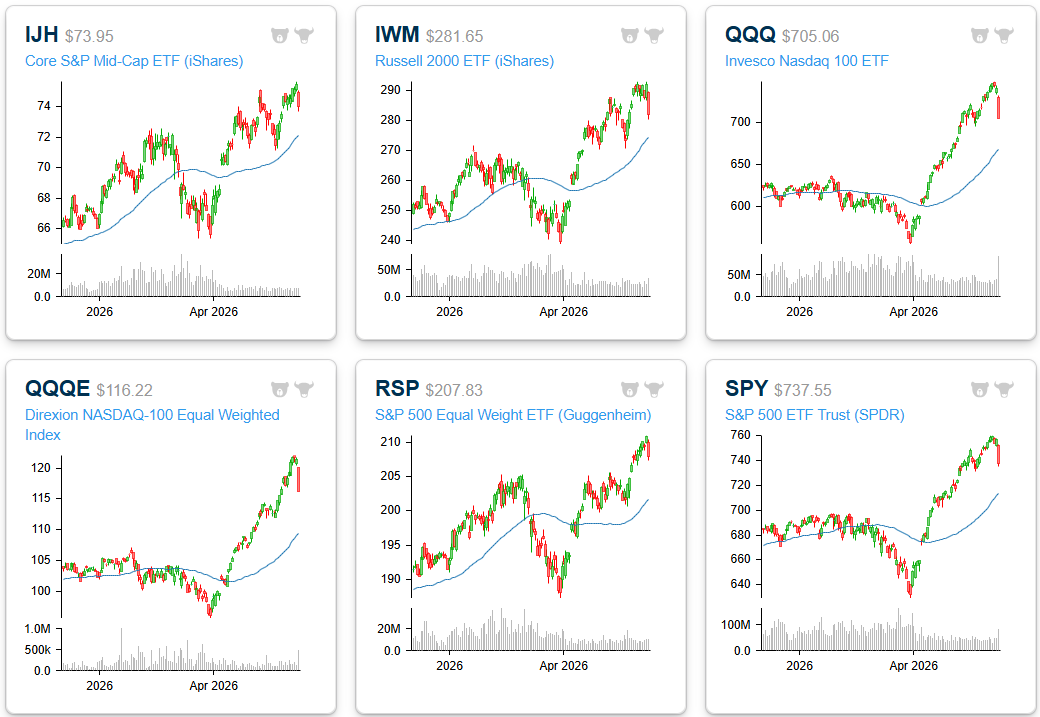
After a 33.7% rally from March 30th through last Tuesday’s close (6/2), traders finally rotated out of the QQQs late last week with a 5% drop from Wednesday through Friday. The S&P 500 ended a nine-week winning streak, and both the S&P and Nasdaq 100 moved out of overbought territory back to “neutral” levels.
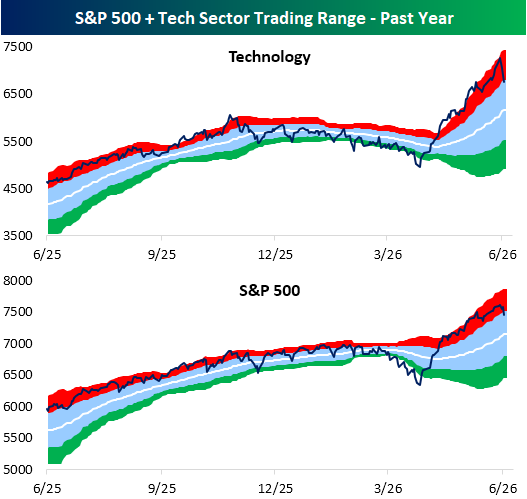
As shown below, even with the drop on Friday, there’s still quite a large gap between current levels and the 50-DMA for both QQQ and SPY.
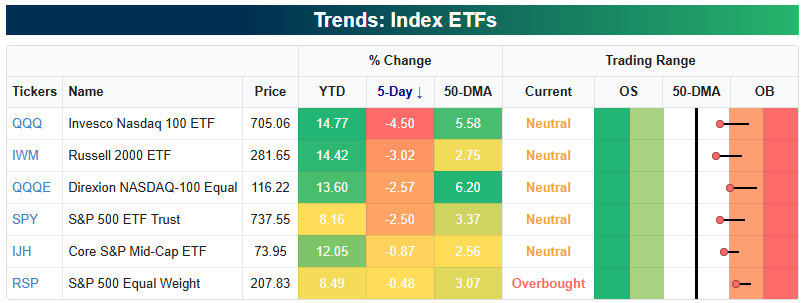
You can see the pullback into neutral territory in the snapshot of key index ETFs from our Trend Analyzer:
Start a two-week trial to Bespoke Premium to continue reading today’s full Morning Lineup.
Brunch Reads – 6/7/26
Welcome to Bespoke Brunch Reads — a linkfest of some of our favorite articles over the past week. The links are mostly market-related, but there are some other interesting subjects covered as well. We hope you enjoy the food for thought as a supplement to the research we provide you during the week.
A Camera in the Courtroom: The June 7, 1937 issue of Time magazine featured something most Americans had never seen before: a photograph of the US Supreme Court in session. Today, that might not sound particularly noteworthy, but at the time, cameras were strictly prohibited inside the courtroom while the court was in session, making the image an extremely rare look at one of the country’s most influential institutions at work.
The photo was reportedly taken by a woman who smuggled a small camera into the courtroom hidden inside her handbag. By cutting a hole in the purse and taking the picture without looking through the viewfinder, she managed to capture the justices hearing arguments from the bench. The image was only the second known photograph of the Court in session and the first taken in the Supreme Court’s new building, which had opened just two years earlier in 1935.
The timing added to the photo’s significance. The Supreme Court was at the center of national attention in 1937 as President Franklin Roosevelt fought with the Court over New Deal legislation and pushed his controversial plan to expand the number of justices. Americans were reading about the Court almost daily, but few had ever seen what it actually looked like during proceedings.
While the photograph didn’t reveal any secrets about how the justices reached their decisions, it did provide a rare visual connection to an institution that largely operated out of public view. Nearly 90 years later, the Supreme Court still does not allow cameras during oral arguments, making that image from Time a reminder of how uncommon it has been for the public to get a firsthand look inside the courtroom.

AI & Technology
Hackers Simply Asked Meta AI to Give Them Access to High-Profile Instagram Accounts. It Worked (404 Media)
Hackers reportedly used Meta’s AI support chatbot to change the email addresses associated with Instagram accounts, allowing them to take over a number of high-profile profiles before the company fixed the flaw. The method circulated in Telegram groups for months and involved using a VPN, initiating a password reset, and convincing the chatbot to swap an account’s recovery email. [Link]
Continue reading our weekly Brunch Reads linkfest by logging in if you’re already a member or signing up for a trial to one of our two membership levels shown below! You can cancel at any time.

Daily Sector Snapshot — 6/5/26
Health Care Flies High
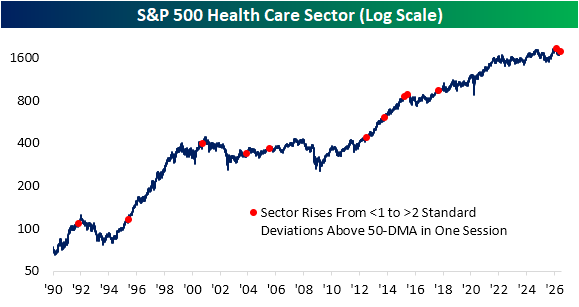
While the S&P 500 is getting hit hard in the past few days (and especially today) largely thanks to weakness in Tech stocks, there has been one glimmer of light. The Health Care sector has been flying higher, now up 5.2% in the past three sessions alone. After that move, Health Care is extremely overbought trading over 3 standard deviations above its 50-DMA. That is the first time the sector traded at least 3 standard deviations above its 50-day since July 21, 2023, and at the current level (3.08 st. dev. above), it is the most overbought since September 11, 2017.
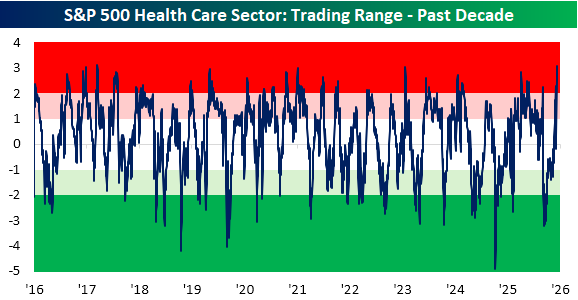
Not only has Health Care gotten extremely overbought, it did so quickly. In fact, as recently as Wednesday, the sector wasn’t even a full standard deviation above its 50-DMA. With an over 3% gain on Thursday, the sector finished over 2 standard deviations above its 50-DMA. Since the start of our data in late 1989, there have only been a dozen times (including this week) that Health Care went from less than one standard deviation above its 50-DMA to extremely overbought in the span of one session. As shown below, the most recent of these was actually this past February, but before that, the last instance was all the way back in 2017.
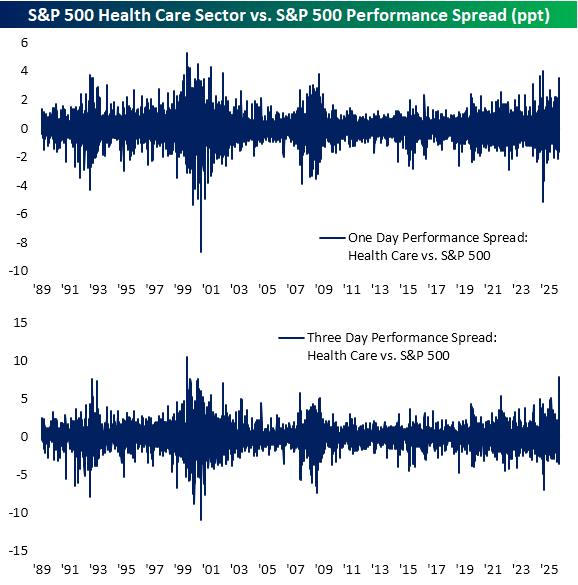
While the size of the move in the past few days is large and the extent to which it has gotten extended is notable, perhaps the most striking aspect of the rally is in relation to the S&P 500. As shown in the first chart below, Health Care’s 1.3% gain versus the S&P 500’s over 2% decline on the session on Friday is one of the largest divergences between the two on record. Factoring in the past three sessions, Health Care’s 7.8 percentage points of outperformance relative to the broader market is second only to January 7, 2000 (when it outperformed by 10.5 percentage points).
Want more from Bespoke? You can start by joining our Think BIG mailing list where you’ll receive an interesting market stat in your inbox a few times per week. All we need is your email address. Join now by clicking here or on the image below.

The End of Overbought?
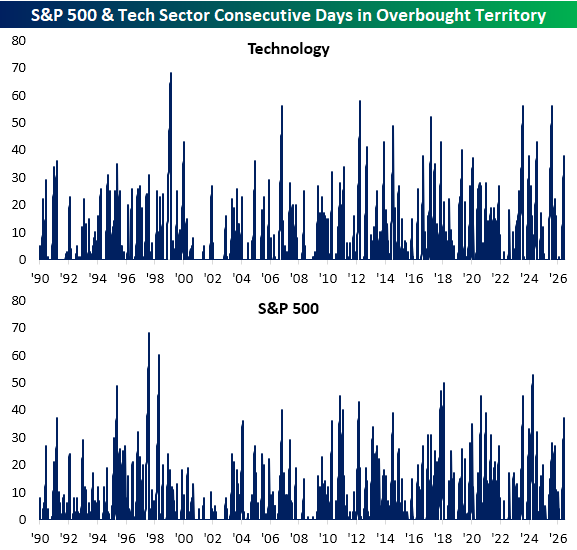
Equities are turning lower to end the week, putting the S&P 500 on pace to end a nine-week winning streak. The 2.25% decline as of this writing today also puts the index on pace to close within one standard deviation of its 50-DMA (neutral territory) for the first time since April 13th. Likewise, the Tech sector that has fueled much of the recent rally is pulling back sharply, eying a 5% decline on the session, to also end its streak of overbought readings.
Tech has been overbought for 38 sessions in a row through yesterday’s close. Assuming today’s decline holds and the sector closes within one standard deviation of the 50-DMA, it would be the longest streak of overbought readings since July 31, 2025 when it had spent 56 sessions in a row in overbought territory. For the S&P 500, the aforementioned streak of elevated closes is now the longest since April 2024.
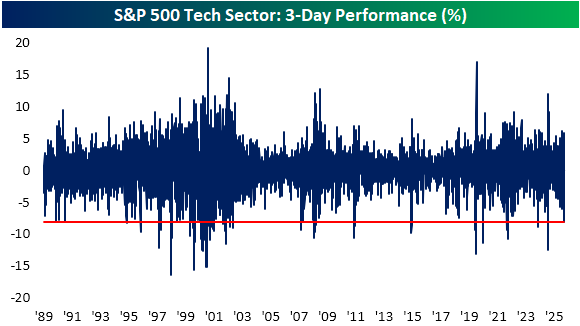
For the broad S&P 500, Friday’s decline is the largest single day drop since October 10, 2025 and for Tech, it’s been even longer since we have seen such a large decline. The sector is one pace to close with the largest daily decline since April 4, 2025.
However, today’s decline is in the context of a few days of weakness. Tech peaked on Tuesday, and at the moment it is down over 8% versus that high. As shown below, that is the largest three day decline since the tariff fueled sell-off in the spring of last year. For all days since sector data beings in late 1989, the three-day drop ranks in the first percentile of all periods.
Want more from Bespoke? You can start by joining our Think BIG mailing list where you’ll receive an interesting market stat in your inbox a few times per week. All we need is your email address. Join now by clicking here or on the image below.
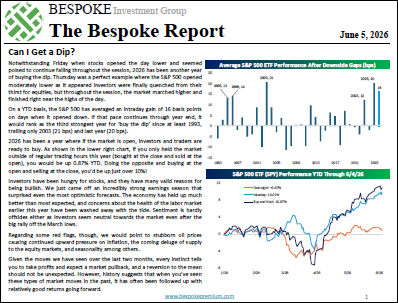
The Bespoke Report – 6/5/26 – Can I Get a Dip?
To read our weekly Bespoke Report newsletter and access everything else Bespoke’s research platform offers, choose one of our three member plans today!
This week’s report covers all you need to know about the market this week, including historic moves in major indices and an insatiable demand for equities. Give it a read!

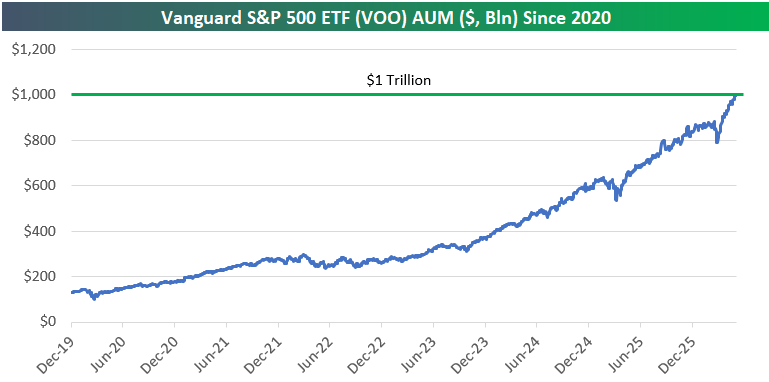
Another $1+ Trillion Club Member: VOO
Along with the now double-digit number of individual stocks with market caps exceeding $1 trillion, an ETF has joined the trillion-dollar club: VOO.
The Vanguard S&P 500 ETF (VOO), which allows investors to own the entirety of the S&P 500, had less than $200 billion in assets under management (AUM) as recently as 2021, but this week, VOO’s AUM crossed above $1 trillion for the first time in history.
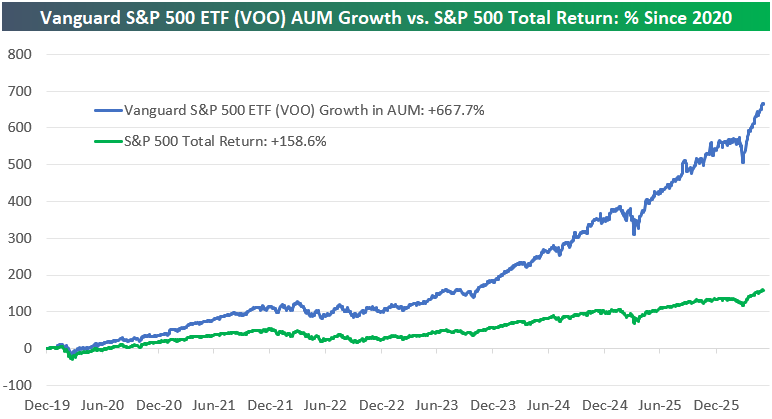
As shown below, while the S&P 500 has returned 158.6% since the start of 2020, VOO — an ETF that tracks the index — has seen AUM grow by 667.7%.
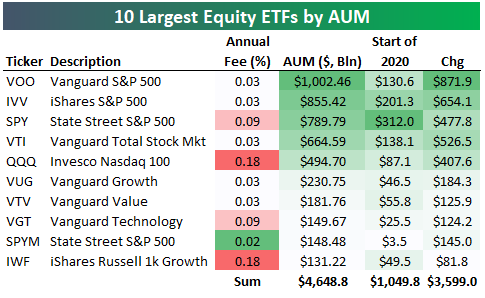
Below is a list of the ten largest equity ETFs traded on US exchanges. The Vanguard S&P 500 ETF (VOO) ranks at the top of the list, followed by the iShares S&P 500 ETF (IVV) at $855.4 billion, then the State Street S&P 500 ETF (SPY) at $789.8 billion.
As most seasoned investors know, SPY was the first-ever US ETF that began trading in 1993, but its 0.09% annual fee has kept it from remaining on top when it comes to AUM. Both VOO and IVV charge just 3 basis points (0.03%) per year. To compete, State Street also offers SPYM, which has a fee that’s one basis point less than the 0.03% charged by VOO and IVV, but SPYM AUM currently sits at $148.5 billion.
Combined, the ten largest equity ETFs now have $4.65 trillion in AUM, up $3.6 trillion since the start of 2020.
With the July 4th holiday coming up, make sure to pick up one (or two or three) of our fun t-shirts or sweatshirts to wear for the 250th. You can find them at Bespoke Threads or an even wider selection at our Task Force 250 store.

Want more from Bespoke? You can start by joining our Think BIG mailing list where you’ll receive an interesting market stat in your inbox a few times per week. All we need is your email address. Join now by clicking here or on the image below.
Bespoke’s Morning Lineup – 6/5/26 – Weak End into the Weekend
See what’s driving market performance around the world in today’s Morning Lineup. Bespoke’s Morning Lineup is the best way to start your trading day. Read it now by starting a two-week trial to Bespoke Premium. CLICK HERE to learn more and start your trial.
“Inspiration usually comes during work, rather than before it.” – Madeleine L’Engle
Below is a snippet of commentary from today’s Morning Lineup. Start a two-week trial to Bespoke Premium to view the full report.
It’s already been a busy week for employment-related news, and most of it has been good. This morning’s labor report will trump all the other reports and help dictate the direction of the markets heading into the weekend and whether the current streak of weekly gains extends to double digits. Wherever the report comes in, though, remember that it is only one snapshot of a much larger mosaic. Odds are it will be revised multiple times over the next several months (years).
Heading into the last session of the week, equity futures are mostly lower. The Nasdaq is indicated to gap down more than 1%, while S&P 500 futures point to a 0.5% decline, and the Dow is indicated slightly higher. If all of this sounds familiar, it’s because the setup was the same yesterday. There are not really any catalysts to blame for the weakness, except that investors are growing increasingly apprehensive about putting new money to work after the massive tech rally and a coming avalanche of supply.
Outside of equities, treasury yields are modestly lower, with the 10-year yielding just below 4.47%. Oil is slightly higher with WTI at $93.25 per barrel as prospects of a peace deal with Iran continue to dangle just over the horizon that we can never seem to reach. Gold is slightly lower, and Bitcoin is down another 2% and approaching $62K.
In Asia, markets closed out a mostly negative week on a down note, with the Nikkei and Hong Kong falling over 1% while South Korea plunged 5%. In Europe, markets are moving in the other direction. The STOXX 600 is up 0.3%, led higher by Spain, which is up 1%. The gains come despite Q1 GDP being revised from growth of 0.1% to a contraction of 0.2%. That was the first negative quarter for the region since 2021.
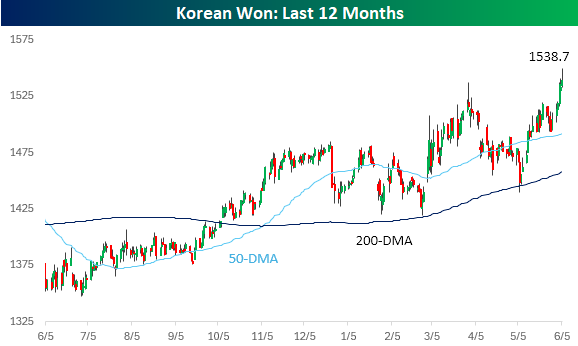
Besides the declines in Asian stocks overnight, the Japanese yen and South Korean won have been weak. Just weeks after the BoJ intervened in the market to defend the currency, the yen has resumed its slide, pushing towards a psychologically important level of 160 versus the dollar. In South Korea, the won has shown steady weakness against the dollar for over a year now (rising line in chart), and just last night traded at its weakest level versus the dollar since 2009.
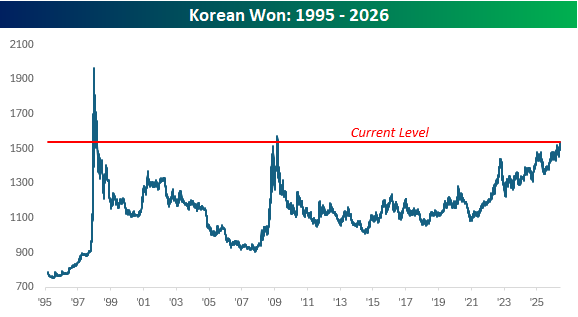
Many comparisons have been made between the current market environment and the late 1990s, and weakness in Asian currencies can just be added to the list. In 1997, we had the Asian currency crisis, which spawned a global market sell-off, so it’s only natural to raise an eyebrow when you see headlines about the South Korean won hitting multi-year lows versus the dollar.
A look at the long-term chart for the won, however, shows that at this point, the decline looks nothing like the weakness we saw in 1997 and 2008. In both of those periods, the weakness went parabolic, whereas the current period of weakness has been a steadier grind. If the slope of the line starts to steepen, though, put on your seatbelt.
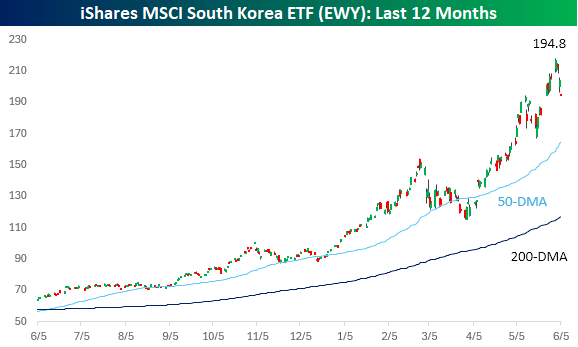
While the won has been weakening, the rate of decline hasn’t been nearly fast enough to offset the rabid gains in the South Korean equity market. Over the last year, the iShares MSCI South Korea ETF (EWY) has more than tripled, rising from around $60 to over $200 earlier this week, and just under $195 in pre-market trading today. At these levels, EWY is holding right at the levels it was after its gap higher in late May after the Memorial Day weekend. If these levels can hold, the recent pullback will look benign, but even after this pullback, prices remain extremely elevated.
Start a two-week trial to Bespoke Premium to continue reading today’s full Morning Lineup.