
Daily Sector Snapshot — 9/14/22
Chart of the Day: Irrational Exuberance Plummets
Fixed Income Weekly: 9/14/22
Searching for ways to better understand the fixed income space or looking for actionable ideas in this asset class? Bespoke’s Fixed Income Weekly provides an update on rates and credit every Wednesday. We start off with a fresh piece of analysis driven by what’s in the headlines or driving the market in a given week. We then provide charts of how US Treasury futures and rates are trading, before moving on to a summary of recent fixed income ETF performance, short-term interest rates including money market funds, and a trade idea. We summarize changes and recent developments for a variety of yield curves (UST, bund, Eurodollar, US breakeven inflation and Bespoke’s Global Yield Curve) before finishing with a review of recent UST yield curve changes, spread changes for major credit products and international bonds, and 1 year return profiles for a cross section of the fixed income world.
In this week’s report we scour inflation markets for evidence of concern over excessive price pressures.

Our Fixed Income Weekly helps investors stay on top of fixed income markets and gain new perspective on the developments in interest rates. You can sign up for a Bespoke research trial below to see this week’s report and everything else Bespoke publishes free for the next two weeks!
Click here and start a 14-day free trial to Bespoke Institutional to see our newest Fixed Income Weekly now!
Big Gap Down Takes Out the 50-Day
Headed into Tuesday, the S&P 500 had been on a solid post-Labor Day rally, however, the hotter-than-expected CPI reading sent stocks reeling. After gapping down below its 50-day moving average, the S&P 500 (SPY) finished the day with a decline of over 4%. Additionally, another technical development of note as a result of yesterday’s move was that the breakout above the past few weeks’ downtrend line appears to have only been a pump fake.

While moves above or below the 50-DMA are a fairly common technical development, those similar to Tuesday are a bit rarer than might be expected at first glance. Prior to yesterday, the S&P 500 ETF (SPY) had only opened below its 50-DMA thanks to a gap down of at least 2% four other times since the ETF began trading in 1993: April 8, 1996, April 27, 2000, June 24, 2016, and February 24th, 2020. Looking across each of these instances, the 2020 occurrence was the only one that was followed by a prolonged period with the SPY staying below its 50-day. By comparison, the 1996 and 2000 instances saw the S&P continue to fluctuate around its 50-day in the months ahead. In fact, the April 2000 occurrence actually saw the S&P 500 rise back above its 50-day by the end of that same day. Meanwhile, the 2016 instance saw SPY quickly regain its losses as it traded above its 50-DMA for much of the next few months. Click here to learn more about Bespoke’s premium stock market research service.

Bespoke’s Morning Lineup – 9/14/22 – Holding For Now
See what’s driving market performance around the world in today’s Morning Lineup. Bespoke’s Morning Lineup is the best way to start your trading day. Read it now by starting a two-week trial to Bespoke Premium. CLICK HERE to learn more and start your trial.
“He who fears being conquered is sure of defeat.” – Napoleon Bonaparte

Below is a snippet of content from today’s Morning Lineup for Bespoke Premium members. Start a two-week trial to Bespoke Premium now to access the full report.
Futures were modestly higher relative to yesterday’s decline for a little while this morning, but those gains have evaporated almost as fast as yesterday’s decline erased the prior four days of gains. Yesterday was pretty much a bloodbath in the equity market as not a single stock in the S&P 1500 was up 5%, and only 18 stocks in the entire index of 1500 stocks were even up on the session. Strangely enough, though, only 12 stocks in the index declined 10%+. For a day when the index was down over 4%, that’s a surprisingly low number. we’ve seen more stocks down by 10%+ on days when the broader market was only down 1%.
After yesterday’s hotter-than-expected CPI report, the August PPI was right in line at the headline level with a 0.1% m/m decline and an 8.7% y/y increase. Stripping out food end energy, the m/m reading was 0.4% compared to expectations for a gain of just 0.3%. The y/y reading was also higher than expected at 7.3% versus forecasts for an increase of 7.0%. This report certainly wasn’t as bad as the CPI report, but levels remain stubbornly high.
At the open yesterday, the S&P 500 erased the prior two days of gains, and by the close, it had basically erased the gains of the two days before that. How’s that for efficiency? As bad as the sell-off was, the one thing bulls have working in their favor is that the uptrend line off the June lows has held for now. If that trendline – currently around 3,920 – doesn’t hold today, it won’t be much of a positive backdrop for a time of year that has historically already been among the weakest times of the year.

Our Morning Lineup keeps readers on top of earnings data, economic news, global headlines, and market internals. We’re biased (of course!), but we think it’s the best and most helpful pre-market report in existence!
Start a two-week trial to Bespoke Premium to read today’s full Morning Lineup.
The Closer – SPR In-The-Money, CPI Surge Fuels Equity Collapse, 30y Auction, ASEC – 9/13/22
Log-in here if you’re a member with access to the Closer.
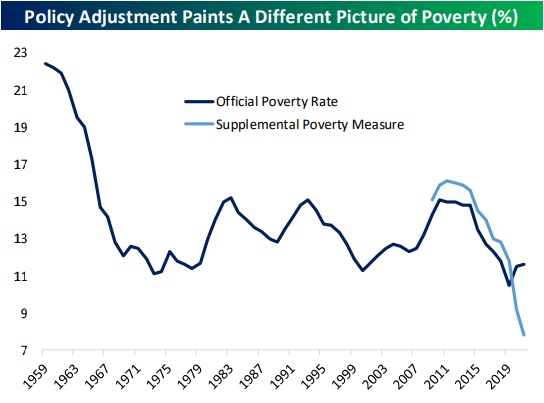
Looking for deeper insight into markets? In tonight’s Closer sent to Bespoke Institutional clients, we start out tonight with a look at what current WTI pricing means for SPR as well as the dramatic Fed repricing after today’s CPI print (page 1). We then take a dive into said CPI report (page 2) followed by a rundown of the strong demand at this afternoon’s long bond reopening (page 3). Afterward, we look at the US Census’ Annual Social and Economic Supplement of the Current Population Survey (page 4 – 8).
See today’s full post-market Closer and everything else Bespoke publishes by starting a 14-day trial to Bespoke Institutional today!
Daily Sector Snapshot — 9/13/22
B.I.G. Tips – Nasdaq 4%+ Declines
Bespoke Stock Scores — 9/13/22
Chart of the Day: Breadth Doesn’t Get Much Hotter
COTD Bullet Points:
- The past week (before Tuesday) has seen outright impressive breadth from the S&P 500 as the 5-day advance/decline line has risen to one of the highest levels of the past decade.
Chart of the Day:
Although equities are pulling back sharply in the wake of the CPI release, leading into today the S&P 500 had taken a straight shot higher since coming back from the Labor Day holiday with the index moving higher each day save for last Tuesday. Even more impressively, it wasn’t just a handful of FANG-type mega caps driving the index higher. Breadth has been impressively strong. Typically, we track short-term breadth using the 10-day advance/decline (A/D) line which we update daily in our Sector Snapshot. While that line was basically neutral heading into today, the 5-day A/D line was at the extreme side of historically positive readings. Reaching a reading of 52.8% as of Monday’s close, the reading ranked in the 99.7th percentile of all days since 1990 when our data begins. As for some other most recent examples of breadth reaching such extended levels, there have been two occurrences in the past year: one near the end of 2021 and one this past May.
To read the rest of today’s Chart of the Day as well as gain access to our other reports and tools, start a two-week trial to Bespoke Premium.
