Bespoke’s Weekly Sector Snapshot — 4/13/23
If At First You Don’t Succeed…
After rallying more than 25% from its intraday low on March 20th, WTI crude oil surged above its 50-day moving average (DMA) last week after the surprise production cut announcement from OPEC+. From there the commodity traded sideways for a few days and then started to rally again Wednesday. That jump put the 200-DMA into play, but on its first attempt, crude came up just short.

With WTI still below its 200-DMA, its current streak of closes below that level remains intact. That extends what has been the longest streak of closes below that level since the record of more than 400 trading days back in April 2016. While this streak is nowhere near as long as that streak, it ranks as one of just eight streaks that have lasted as long or longer. Not only that but if the current streak lasts another three weeks, it will move up to number five in terms of the longest streaks below the 200-DMA.

Have you tried Bespoke All Access yet?
Bespoke’s All Access research package is quick-hitting, actionable, and easily digestible. Bespoke’s unique data points and analysis help investors better visualize underlying market trends to ultimately make more informed investment decisions.
Our daily research consists of a pre-market note, a post-market note, and our Chart of the Day. These three daily reports are supplemented with additional research pieces covering ETFs and asset allocation trends, global macro analysis, earnings and conference call analysis, market breadth and internals, economic indicator databases, growth and dividend income stock baskets, and unique interactive trading tools.
Click here to sign up for a one-month trial to Bespoke All Access, or you can read even more about Bespoke All Access here.

Sentiment: Back to the 20s
Whereas last week saw a huge rebound in bullish sentiment after the S&P 500’s breakout above March highs, the more listless price action of the past week resulted in a modest turnaround in sentiment. The latest AAII sentiment survey showed only 26.1% of respondents reported as bullish compared to the recent high of 33.3% last week. The 7.2 percentage point decline was the largest one-week drop in bulls since the last week of February when it declined by 12.5 percentage points. That leaves bullish sentiment right in the middle of the range since the start of 2022.
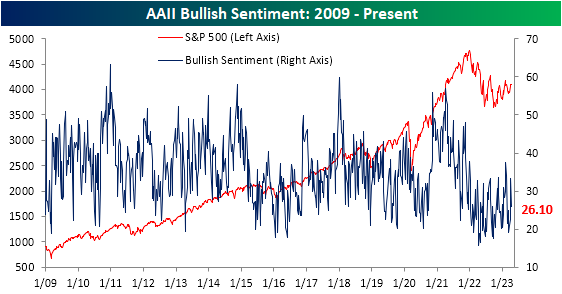
Although bullish sentiment fell, without any considerable push lower for the S&P 500, bearish sentiment went little changed falling just half of one percentage point down to 34.5%. Like last week, that remains the lowest reading since the week of February 16th.

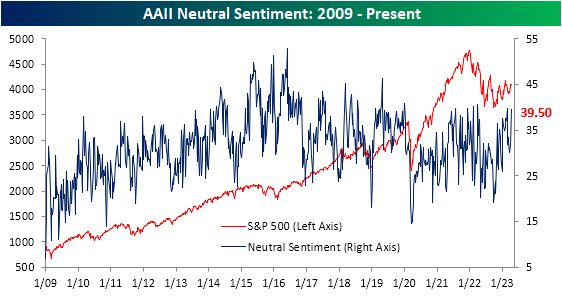
That means that all of the declines in bullish and bearish sentiment flowed to the neutral camp with a surge of 7.9 percentage points; the largest one-week increase since the first week of the year. At 39.5%, neutral sentiment is at the high end of the past few years’ range and only 0.3 percentage points below the late February high.
The AAII survey was not the only sentiment reading to take a more bearish tone this week. The NAAIM Exposure index’s latest release today showed investment managers reduced equity exposure. Meanwhile, the Investors Intelligence survey’s bull-bear spread has actually continued to rise resulting in the highest reading since the first week of 2022. Additionally, as we noted in Monday’s Chart of the Day, the TD Ameritrade Investor Movement Index went unchanged in March after rebounding in the proceeding few months. In other words, across multiple readings, sentiment has improved but has yet to definitively shift to bullish.

Have you tried Bespoke All Access yet?
Bespoke’s All Access research package is quick-hitting, actionable, and easily digestible. Bespoke’s unique data points and analysis help investors better visualize underlying market trends to ultimately make more informed investment decisions.
Our daily research consists of a pre-market note, a post-market note, and our Chart of the Day. These three daily reports are supplemented with additional research pieces covering ETFs and asset allocation trends, global macro analysis, earnings and conference call analysis, market breadth and internals, economic indicator databases, growth and dividend income stock baskets, and unique interactive trading tools.
Click here to sign up for a one-month trial to Bespoke All Access, or you can read even more about Bespoke All Access here.
Claims Resume Their Trend Higher
Initial jobless claims were expected to tick higher this week with forecasts calling for a rise to 235K. Instead, the increase was even more pronounced moving up to 239K from last week’s unrevised reading of 228K. As we detailed last Thursday, the revisions to claims have resulted in a total shift in this indicator of the labor market. After seasonal adjustment, claims are now definitively trending higher since the September low.

Before seasonal adjustment, claims were likewise higher week over week as could be expected given seasonal tendencies. As shown below, the current week of the year has often seen claims rise. In fact, historically unadjusted claims have risen 85.7% of the time during the current week of the year. That is tied with three others (the weeks of approximately January 8th, October 1st, and November 5th) for the week of the year to most consistently see claims increase week over week. Given that increase, levels this year are similar to those of the several years prior to the pandemic meaning that claims remain healthy before seasonal adjustment.

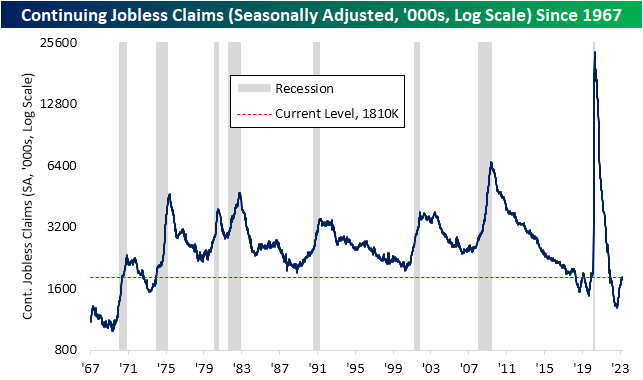
Whereas initial claims came in higher than expected, continuing claims actually were healthier. Instead of the 10K increase penciled in by forecasters, continuing claims fell by 13K to 1.823 million. Although in the short term that is a stronger-than-expected reading, continuing claims remain in an uptrend since the fall and are now at the high end of the range of readings that were common in the two years leading up to the pandemic.
Have you tried Bespoke All Access yet?
Bespoke’s All Access research package is quick-hitting, actionable, and easily digestible. Bespoke’s unique data points and analysis help investors better visualize underlying market trends to ultimately make more informed investment decisions.
Our daily research consists of a pre-market note, a post-market note, and our Chart of the Day. These three daily reports are supplemented with additional research pieces covering ETFs and asset allocation trends, global macro analysis, earnings and conference call analysis, market breadth and internals, economic indicator databases, growth and dividend income stock baskets, and unique interactive trading tools.
Click here to sign up for a one-month trial to Bespoke All Access, or you can read even more about Bespoke All Access here.
Chart of the Day: PPI Deflates, CPI Lags
Bespoke’s Morning Lineup – 4/13/23 – PPI and Claims
See what’s driving market performance around the world in today’s Morning Lineup. Bespoke’s Morning Lineup is the best way to start your trading day. Read it now by starting a two-week trial to Bespoke Premium. CLICK HERE to learn more and start your trial.
“People who exit the stock market to avoid a decline are odds-on favorites to miss the next rally.” – Peter Lynch

Below is a snippet of content from today’s Morning Lineup for Bespoke Premium members. Start a two-week trial to Bespoke Premium now to access the full report.
Yesterday’s weaker-than-expected headline CPI for March didn’t ultimately do much to boost the market, and today the focus will shift to the PPI which is expected to come in unchanged m/m at the headline level and increase 0.2% on a core basis. Along with PPI, jobless claims will also be released, and those are expected to increase to 235K from 228K last week. After weeks of thinking that initial claims were stuck below 200K, we learned last week that after benchmark revisions claims have actually been above 200K for nine straight weeks and 18 of the last 20. Amazing how some revisions can have such an impactful change on the narrative.
We don’t know what to call what the market has done over the last six months, but yesterday did mark the six-month anniversary of the October low. The S&P 500 is up 12.6%, and its peak performance was a gain of 14.4% as of February 2nd before the stronger-than-expected January employment report sparked a sell-off of nearly 8%. During that decline, the S&P 500 managed to stay above its prior low from December, and in the rally that followed it has yet to even test its February high. That’s just another reason we don’t know what to call what the market has done over the last six months. New bull market? Bear market rally? We are in a bit of a no man’s land.
The chart below shows the performance of the S&P 500 and its industry groups since the 10/12 closing low (blue bars) and each one’s peak performance from the close on 10/12 (gray bars). Semis have been leading the way higher, and it’s not even close. Through yesterday’s close, the group was up over 50%, and at its post-October peak, it was up just shy of 60%. Behind Semis, the only other groups in ‘bull market territory’ (up 20%+) are Consumer Durables, Consumer Services, Software, and Capital Goods.
With only five groups up 20%, it’s not the type of performance you would expect to see if this was a bull market, but at the same time, there has been nothing normal about anything market or economic-related in the last three years. While only five groups are currently up 20%, 14 of the 24 have been up at least 20% relative to their 10/12 close at some point since then. The fact that Semis have led the advance is probably one of the most encouraging characteristics of the market’s performance over the last six months. The group is one of the most cyclical of them all and the best leading indicator for the broader market.

Our Morning Lineup keeps readers on top of earnings data, economic news, global headlines, and market internals. We’re biased (of course!), but we think it’s the best and most helpful pre-market report in existence!
Start a two-week trial to Bespoke Premium to read today’s full Morning Lineup.
The Closer – Fed Recession Forecast, Transitioning to Lower Inflation – 4/12/23
Log-in here if you’re a member with access to the Closer.
Looking for deeper insight into markets? In tonight’s Closer sent to Bespoke Institutional clients, we begin with commentary reviewing today’s FOMC meeting minutes (page 1) followed by a look into the latest CPI data (pages 2 and 3). We then take a look at the latest EIA data (page 4) and 10 year note reopening (page 5).

See today’s full post-market Closer and everything else Bespoke publishes by starting a 14-day trial to Bespoke Institutional today!
Daily Sector Snapshot — 4/12/23
The Triple Play Report — 4/12/23
An earnings triple play is a stock that reports earnings and manages to 1) beat analyst EPS estimates, 2) beat analyst sales estimates, and 3) raise forward guidance. You can read more about “triple plays” at Investopedia.com where they’ve given Bespoke credit for popularizing the term. We like triple plays as an indication that a company’s business is firing on all cylinders, with above-expectations results and an improving outlook. A triple play is indicative of positive “fundamental momentum” instead of pure fundamentals, and there are always plenty of names with both high and low valuations on our quarterly list.
Bespoke’s Triple Play Report highlights companies that have recently reported earnings triple plays, and it features commentary from management on triple-play conference calls, company descriptions and analysis, and price charts. Bespoke’s Triple Play Report is available at the Bespoke Institutional level only. You can sign up for Bespoke Institutional now and receive a 14-day trial to read this week’s Triple Play Report, which features seven stocks. To sign up, choose either the monthly or annual checkout link below:
Bespoke Institutional – Monthly Payment Plan
Bespoke Institutional – Annual Payment Plan

Fixed Income Weekly: 4/12/23
Searching for ways to better understand the fixed income space or looking for actionable ideas in this asset class? Bespoke’s Fixed Income Weekly provides an update on rates and credit every Wednesday. We start off with a fresh piece of analysis driven by what’s in the headlines or driving the market in a given week. We then provide charts of how US Treasury futures and rates are trading, before moving on to a summary of recent fixed income ETF performance, short-term interest rates including money market funds, and a trade idea. We summarize changes and recent developments for a variety of yield curves (UST, bund, Eurodollar, US breakeven inflation and Bespoke’s Global Yield Curve) before finishing with a review of recent UST yield curve changes, spread changes for major credit products and international bonds, and 1 year return profiles for a cross section of the fixed income world.
In this week’s report, we discuss shifting regimes in real rates and inflation pricing.

Our Fixed Income Weekly helps investors stay on top of fixed-income markets and gain new perspectives on the developments in interest rates. You can sign up for a Bespoke research trial below to see this week’s report and everything else Bespoke publishes free for the next two weeks!
Click here and start a 14-day free trial to Bespoke Institutional to see our newest Fixed Income Weekly now!