The Closer – Tech at New Highs, CPI, Product Prices Diverge, 10Y Auction – 5/10/23
Log-in here if you’re a member with access to the Closer.
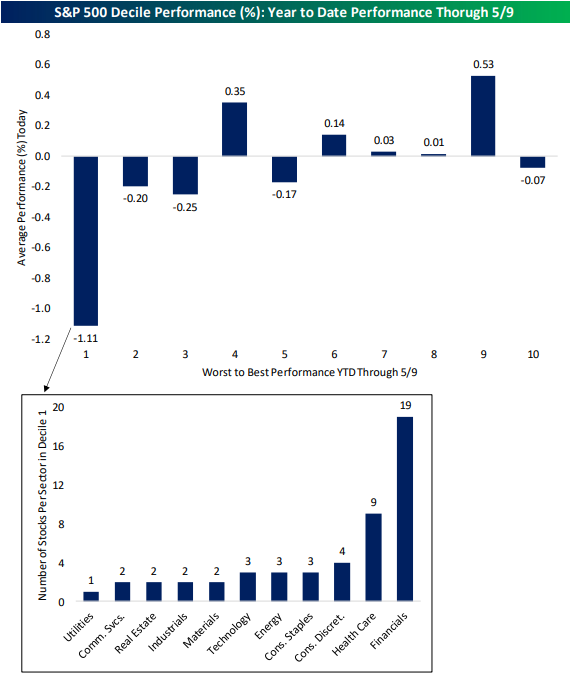
Looking for deeper insight into markets? In tonight’s Closer sent to Bespoke Institutional clients, we start out with earnings recaps and a look at performance of S&P 500 stocks today based on year to date performance (page 1). We follow up with a look at Tech’s new 52-week high (page 2) before switching over to macro data to run down today’s CPI print (pages 3 and 4). We then review the latest EIA data (page 5) and energy prices (page 6) before closing out with a recap of the 10 year note auction (page 7).
See today’s full post-market Closer and everything else Bespoke publishes by starting a 14-day trial to Bespoke Institutional today!
Daily Sector Snapshot — 5/10/23
Chart of the Day – Historical Declines in Headline CPI
Bespoke’s Morning Lineup – 5/10/23 – Under 5
See what’s driving market performance around the world in today’s Morning Lineup. Bespoke’s Morning Lineup is the best way to start your trading day. Read it now by starting a two-week trial to Bespoke Premium. CLICK HERE to learn more and start your trial.
“The higher up you go, the more mistakes you are allowed. Right at the top, if you make enough of them, it’s considered to be your style.” – Fred Astaire

Below is a snippet of content from today’s Morning Lineup for Bespoke Premium members. Start a two-week trial to Bespoke Premium now to access the full report.
As expected, Congressional leaders made little headway on the debt ceiling and then blamed each other for the stalemate. Given the low expectations, the market reaction was muted. Plus, investors have bigger fish to fry with the release of the April CPI which was expected to increase 0.4% on a m/m basis at both the headline and core levels. On a y/y basis, the headline level was expected to increase by 5.0%, while the core was forecast to increase by a more concerning 5.5%. The actual readings came in right in line with expectations although the headline y/y reading was slightly lower at 4.9%.
Equity futures were modestly lower heading into the report, following the lead of Asia and Europe, while treasuries were mixed, and crude oil was lower trading at $73 per barrel. Investors were clearly positioned for a hot reading, so the initial reaction from the market has been for equities and bonds to reverse their pre-market losses as the two-year yield drops back below 4%.
Semiconductors are an area of the market to watch here. After a lousy April where the Philadelphia Semiconductor Index (SOX) fell 7.3%, the index is down about another 1% so far in May, and the technical picture doesn’t look so great. The index broke below its 50-day moving average (DMA) in the middle of April and hasn’t been able to reclaim that level ever since. Not only that, but the SOX also broke its uptrend from the October lows. Last week, it tried to trade back above both its former uptrend and the 50-DMA but was rejected. Subsequently, last Friday it made another attempt at the 50-DMA but failed again. The S&P 500 has been having its own problems trading back above 4200, and unless the semis can regain their March traction, it could be a tough grind. On any downside in the SOX, the first level of support comes into play at around 2,850 (blue line) or about 3.5% below current levels.

Start a two-week trial to Bespoke Premium to read today’s full Morning Lineup.
The Closer – Investor Movement and Consumer Confidence, Record 3Y Note Sale – 5/9/23
Log-in here if you’re a member with access to the Closer.
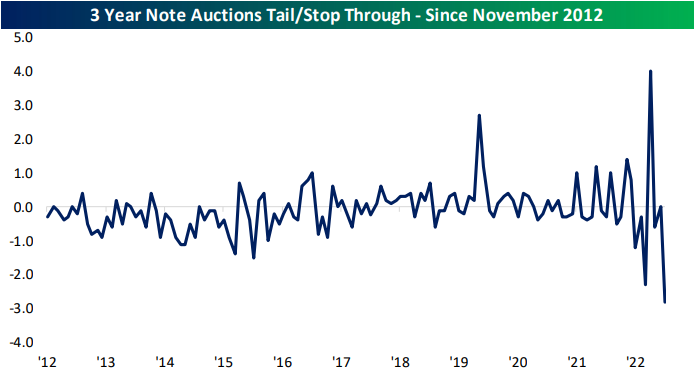
Looking for deeper insight into markets? In tonight’s Closer sent to Bespoke Institutional clients, we begin with recaps of the latest earnings (page 1) followed by a preview of performance on CPI days of the S&P 500 and its industry groups (page 2). We then dive into the latest sentiment figures for investors (page 3), potential homebuyers (page 4 and 5), and consumers (page 6). We finish with a review of today’s record setting 3 year note auction (page 7).
See today’s full post-market Closer and everything else Bespoke publishes by starting a 14-day trial to Bespoke Institutional today!
Daily Sector Snapshot — 5/9/23
B.I.G. Tips — 2011 Was Different
Chart of the Day – Housing Market Hotness
Bespoke Stock Scores — 5/9/23
Bespoke’s Morning Lineup – 5/9/23 – Less Confidence
See what’s driving market performance around the world in today’s Morning Lineup. Bespoke’s Morning Lineup is the best way to start your trading day. Read it now by starting a two-week trial to Bespoke Premium. CLICK HERE to learn more and start your trial.
“No one knows what interest rate the market would set, it’s always being manipulated.” – William Dunkelberg, NFIB
Below is a snippet of content from today’s Morning Lineup for Bespoke Premium members. Start a two-week trial to Bespoke Premium now to access the full report.
After Friday’s surge didn’t have much in the way of follow-through yesterday, bears have the upper hand this morning as futures are decidedly weaker, and treasury yields are lower (although they’re pretty much exactly where they were at this point yesterday morning). Investors will also be looking ahead to this afternoon’s meeting between the President and leaders of Congress over the debt ceiling. Expectations are low, but you never know. The fact that the President and his advisers are willing to meet after already saying they wouldn’t negotiate, is a small sliver of hope.
The performance of individual stocks grouped by market cap has been interesting to watch this year and for now, has laid to waste the notion that big things come in small packages. The chart below summarizes the average YTD performance of stocks in various major US indices, and while it may look at first like it’s sorted left to right from best to worst, it’s actually by the market cap of stocks that each index represents from largest to smallest. On the left, are the Nasdaq 100 and S&P 100 which are comprised of US mega-caps. The average YTD performance of Nasdaq 100 stocks has been a gain of 11.45% while the 100 components of the S&P 100 are up an average of 4.93% YTD. Broadening out a little bit to the large-cap S&P 500, the average YTD return of those stocks has been a gain of 2.58%.
Stepping down the market cap ladder from large caps, the average YTD return of mid-cap stocks in the S&P 400 has been a gain of 2.13%. Finally, at the bottom rungs, we have small and microcap stocks which are the only two of the six indices shown where the average YTD return is negative (-1.89% for stocks in the S&P 600 and -0.28% for stocks in the Russell Microcap index). It’s at these last two indices where the progression of performance getting incrementally weaker also breaks down.

Given its outperformance YTD, it shouldn’t come as a surprise that the Nasdaq 100 is closer to a 52-week high than any of its peers. The index has essentially been rangebound since a breakout on March 31, but after last Friday’s surge and Monday’s follow-through, it’s making its best effort to break out again. Based on where futures are trading this morning, it doesn’t look like it’s going to happen today, but a lot can change over the course of a few hours, and Wednesday’s CPI will most certainly have a say in how things play out.

Start a two-week trial to Bespoke Premium to read today’s full Morning Lineup.