Daily Sector Snapshot — 3/18/26
Bespoke Baskets Update – March 2026
Q4 2025 Earnings Conference Call Recaps: Williams-Sonoma (WSM)
Bespoke’s Conference Call Recaps use AI to summarize lengthy earnings calls. The commentary below is AI-generated and then edited by Bespoke for quality control. As always, none of these summaries should be construed as recommendations to buy or sell any securities, and investors should do their own research and/or consult with a financial professional before making any investment decisions.
Our latest recap available to Bespoke subscribers covers Williams-Sonoma’s (WSM) Q4 2025 earnings call.
![]()
Williams-Sonoma (WSM) is a premium home furnishings retailer operating a multi-brand portfolio including Pottery Barn, West Elm, and Williams-Sonoma, selling furniture, décor, kitchenware, and design services through a digital-first, omnichannel model. WSM delivered a 3.2% Q4 comp and 20.3% operating margin despite tariff headwinds and weak housing turnover, gaining share while maintaining full-price selling. Management emphasized resilience to tariffs through sourcing and pricing actions, with margin pressure expected to be front-half weighted in 2026. Growth is being driven by product newness, collaborations, and emerging brands, while B2B (+10% FY growth) and Rejuvenation remain key white-space opportunities. The company is pivoting back to retail expansion (20 new stores, 19 repositions) after years of optimization. Pottery Barn lagged in Q4 due to weak décor assortment, but is being reset with stronger product and brand positioning. WSM reported weaker revenue on better-than-expected EPS, resulting in shares up as much as 6% on 3/18…
Continue reading our Conference Call Recap for WSM by becoming a Bespoke Institutional subscriber. You can sign up for Bespoke Institutional now and receive a 14-day trial to read our newest Conference Call Recap. To sign up, choose either the monthly or annual checkout link below:
Chart of the Day – Gold Loses Its Glitter
Bespoke’s Morning Lineup – 3/18/26 – Fed Who?
See what’s driving market performance around the world in today’s Morning Lineup. Bespoke’s Morning Lineup is the best way to start your trading day. Read it now by starting a two-week trial to Bespoke Premium. CLICK HERE to learn more and start your trial.
“If you don’t understand what the professor is saying, don’t dismiss the possibility that he might be wrong.” – Paul Volcker

Below is a snippet of commentary from today’s Morning Lineup. Start a two-week trial to Bespoke Premium to view the full report.
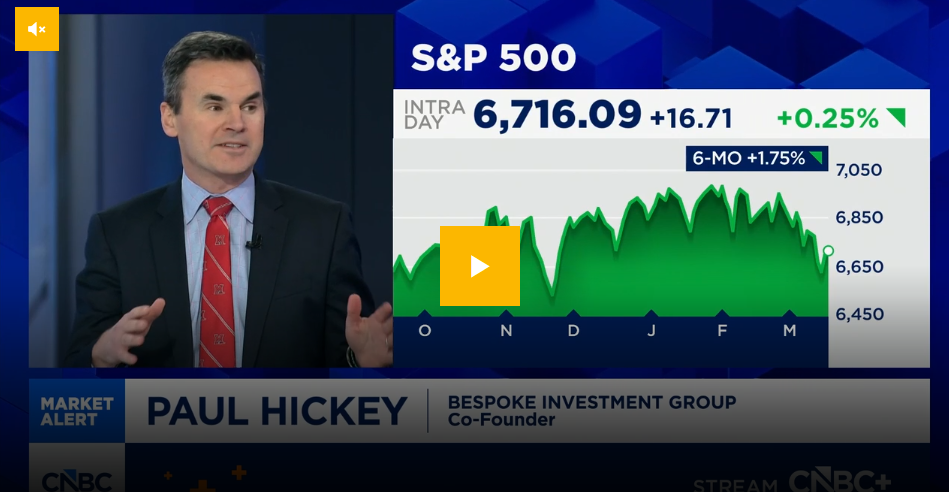
Paul Hickey appeared on CNBC Overtime yesterday to discuss the sideways trending market and volatility underneath the surface. To view the segment, click on the image below.
Futures are still green, but they have given up most of their earlier gains as we approach the opening bell. It appears some of the weakness may be tied to reports of a strike on some Iranian energy facilities. Conversely, oil prices are lower but have erased most of their earlier losses. Treasury yields are basically unchanged, gold is down close to 2%, while Bitcoin is down over 2% and back below $73K.
Equities in Asia had a very strong session overnight, with the Nikkei up 2.9%, while South Korea surged 5.0%. Other major indices in the region were also green but by less than 1%. Catalysts behind the move include a lack of continued upside in oil prices, stronger-than-expected export orders in Japan, and positive comments from Samsung related to AI chip demand being strong.
European stocks have also started the day on a positive note, with the STOXX 600 up 0.6%, led higher by Spain, Italy, and France, which are all up over 1%. Besides lower oil prices, February CPI also rose less than expected (0.6% vs 0.7%). Tomorrow, we’ll also get policy decisions from the ECB, BoE, and SNB.
The economic calendar is busy this morning with PPI at 8:30, followed by Factory Orders and Durable Goods at 10 AM Eastern. After that, attention will shift to the FOMC, where Powell & Co are widely expected to leave rates unchanged at 2 PM. Investors will be focused on the press conference and summary of economic projections, but with all the uncertainty around oil supplies, take them with a grain of salt. The PPI just hit the tape and the numbers were much higher than expected, so that has pushed futures into negative territory.
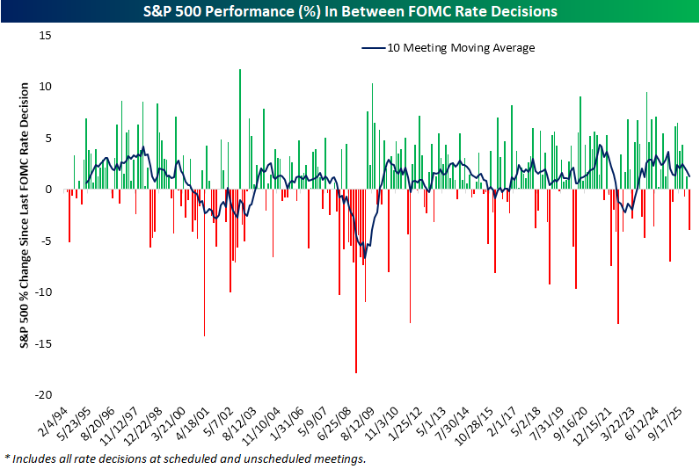
In our FOMC meeting preview report sent out yesterday, we highlighted some of the key trends surrounding Fed days. The report included an overview of the market’s performance leading up to meetings and how it performs on the day of the announcement, how the market performs based on what the FOMC does (or doesn’t do), as well as how it performs on an intraday basis based on different scenarios.
One of the charts included showed the performance of the S&P 500 between FOMC meetings, and heading into today’s announcement, the S&P 500 is down about 4% since its last meeting in January. As shown, that ranks as the worst inter-meeting performance in a year and also ranks in the 15th percentile of all inter-meeting periods since 1994, when the Fed first started announcing its rate decisions on the day of its meetings. It gets worse than the last six weeks, but not much worse!
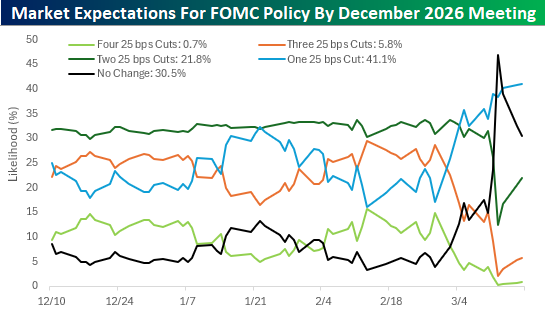
The market is currently pricing in a greater than 99% likelihood of no change in rates by the Fed today, and with the war in Iran taking center stage, there is not likely to be nearly as much attention put on Powell’s penultimate press conference this afternoon. When it comes to policy, though, there have been some major shifts in market expectations for policy between now and the last meeting for 2026 in December.
The chart below shows the change in expectations for various policy levels since the Fed last cut rates in December. While the market is currently pricing in an almost one in three chance of no change in rates between now and December, less than three weeks ago, the market was pricing in a less than 5% chance of no change in rates. Instead, the odds were heavily on cuts with a 41% chance of two cuts, a 29% chance of three cuts, a 15% chance of four cuts, and just a 17% chance of only one cut. Today, the trend has completely reversed. There’s now a greater than 70% likelihood of one cut or less, and barely more than a one in four chance of two or more cuts.
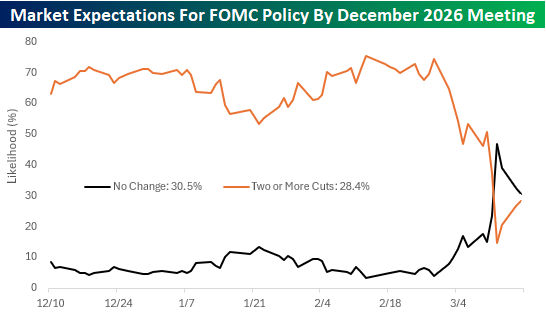
To show the shift more clearly, the chart below shows the change in market pricing for no change in rates versus two or more cuts. For three months, market expectations were pretty steady, but then that quickly changed at the end of February with one word – Iran.
The Closer – FOMC, Energy, Credit – 3/17/26
Log-in here if you’re a member with access to the Closer.
- Since the last FOMC meeting on January 28th, the Fed Funds future curve has shifted justifiably and dramatically.
- Stocks with the highest international revenue exposure have seen large moves since the start of the war in Iran.
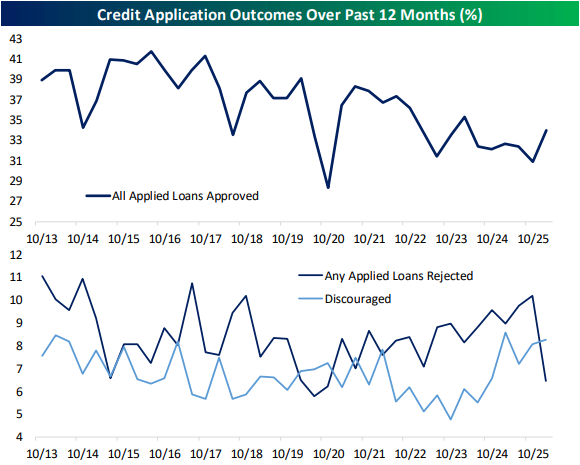
- February saw a steep decline in the number of consumers receiving rejections after applying for credit.
See today’s full post-market Closer and everything else Bespoke publishes by starting a 14-day trial to Bespoke Institutional today!
Daily Sector Snapshot — 3/17/26
B.I.G. Tips – Powell’s Penultimate Meeting
Chart of the Day – NVDA Stalls, But Semis Keep Trucking
Past the Ides of March
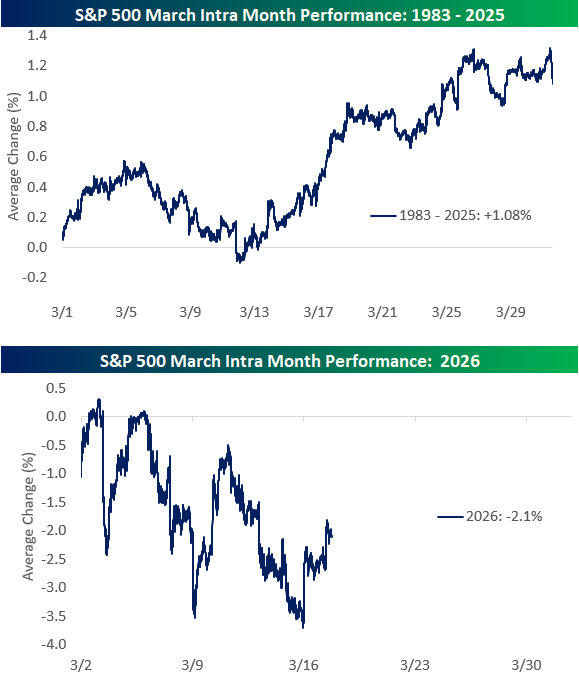
The S&P 500 fell more than 3% in the first half of March, but there’s reason to be more optimistic from a seasonal perspective. As we highlighted in this Chart of the Day for members at the start of the month, March gains have historically been back-end loaded.
The top chart below shows the S&P 500’s average path during the month of March since 1983. The second chart shows the S&P’s price action so far this March.
Historically, the market has traded relatively flat through the Ides of March and then picks up steam with gains in the back half of the month.
So far this week, we’ve seen the bulls get back to work with the S&P up more than 1% as of noon on Tuesday. We’ll see if the gains can hold and continue following the historical script with a strong finish to the month.
Sign up for Bespoke’s Think BIG mailing list to receive an interesting market stat like this in your inbox a few times per week. Click here or on the image below to sign up. An email is all we need!

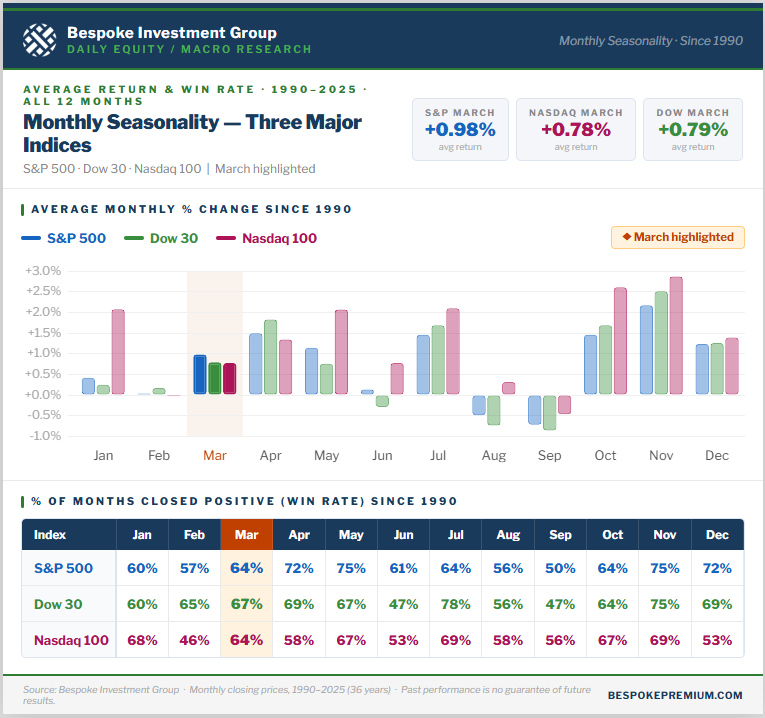
For more context on market seasonality, the graphic below was featured in our Chart of the Day for members back on March 2nd. It shows the average monthly percentage change for the S&P 500, Nasdaq 100, and Dow 30 since 1990.
While March has typically seen gains of just under 1% for all three indices, April has been an even better month over the years!
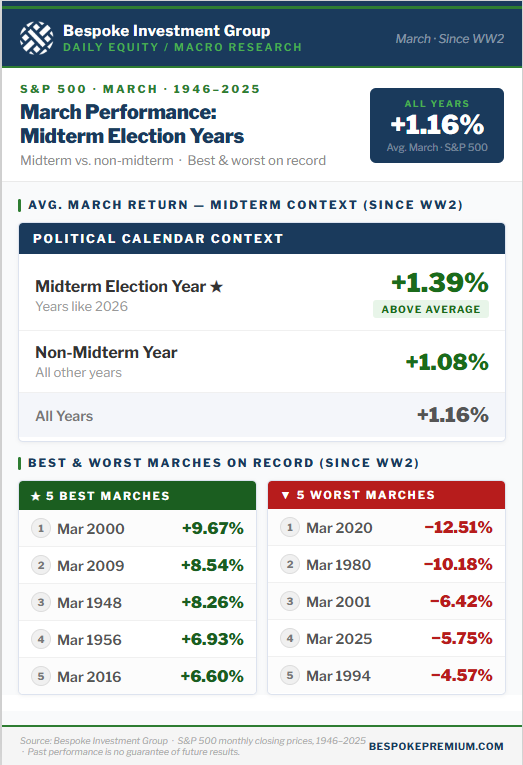
In addition to the graphic above, the one below shows how the market has performed in March during midterm election years like 2026 versus all other years. As shown, the market has historically done slightly better in March during midterm years with an average gain of 1.39% since WW2.
Like this analysis? Receive our Chart of the Day in your inbox each day by starting a Bespoke trial! Click below for details on how to sign up:
