Bespoke’s Weekly Sector Snapshot — 11/2/23
Bears Shrug Off a Rally
Even though the S&P 500 has moved decisively higher over the past week, sentiment has entirely shrugged off price action. The percentage of respondents reporting as bullish to the AAII’s weekly sentiment survey dropped back below 25% versus a reading of 29.3% last week. Bullish sentiment has now dropped for three straight weeks, having fallen 15.7 percentage points in that span for the largest three-week decline since August 24th. That has also resulted in the lowest bullish sentiment reading since May 18th.

That was matched with a rise in bearish sentiment back above 50%. That was the first time a majority of respondents reported as bearish since last December. As shown in the second chart below, the 44 consecutive weeks weeks without such a reading is sizeable, but far from any sort of record.


With new near-term lows in bulls and highs in bears, the spread between the two widened to 26 points in favor of bears. That is the most negative bull-bear spread reading since March

Other sentiment surveys echoed that negative tone among investors. The NAAIM Exposure Index was actually slightly higher week over week, although it continues to show low levels of long equity exposure. Meanwhile, like the AAII Bull-Bear spread, the Investors Intelligence survey also indicated the most bearish reading since March. Put together, our sentiment composite is now back below -1. That means the average sentiment reading is a full standard deviation more bearish than its historical average for the weakest reading since the first week of the year. Although current readings are rather pessimistic, due to the timing of data collection, the results would not have captured any response in sentiment following the FOMC on Wednesday. In other words, next week we will get a read if the latest updates on monetary policy had any effect on investor pessimism.


Continuing Claims Keep On Rising
Following up on yesterday’s slowing ADP and JOLTS numbers, today’s release of weekly jobless claims likewise showed a cooling labor market. Initial claims were revised up by 2K last week to 212K, and this week’s number came in higher at 217K. That was 7K above expectations which would have assumed no change to claims. With the rise over the past two weeks, claims have now rounded out a bottom but still have significant headroom until reaching the highs from earlier this year.

Before seasonal adjustment, claims were slightly higher at 196.8K. That increase is consistent with seasonal patterns as claims tend to rise throughout Q4. For example, the current week of the year has historically seen claims rise week over week 83.9% of the time; one of the most consistent weeks of increases of the year. Granted, claims are experiencing the usual seasonal increase and have bottomed after seasonal adjustment, but current levels remain historically strong. For instance, this week’s NSA number is right inline with those readings of the comparable week of the couple of years before the pandemic and 2022.

Continuing claims are a less rosy picture with a much greater and more consistent increase over the past several weeks. Since the recent low of 1.658 million put in place in early September, continuing claims have risen 9.65%. As shown below, that is certainly on the large side of historical increases in such a time span. In fact, most other times (though not always) claims have risen that rapidly, the economy has been in recession. Given that rise, seasonally adjusted continuing claims topped 1.8 million this week, which is the most elevated reading since April 15th and is only 43K below the recent high from the spring. Zooming further out, though, claims remain at historically strong levels.


Chart of the Day – Bond Yields Collapse
Bespoke’s Morning Lineup – 11/2/23 – Was it Something He Said?
See what’s driving market performance around the world in today’s Morning Lineup. Bespoke’s Morning Lineup is the best way to start your trading day. Read it now by starting a two-week trial to Bespoke Premium. CLICK HERE to learn more and start your trial.
“Once you consent to some concession, you can never cancel it and put things back the way they are.” – Howard Hughes

Start a two-week trial to Bespoke Premium now to get full access to the Morning Lineup.
Stocks are poised to trade higher for the fourth day in a row this morning continuing the positive momentum from yesterday’s trading and a strong session in Europe. Movement in the fixed-income space is also helping as the 10-year yield drops below 4.70%. There’s still a lot of economic data to get through today, and after what has already been a busy day of earnings, there’s still a ton of reports after the close including the biggest of them all – Apple (AAPL) – after the close today. On the economic calendar, we just got a slug of data. Non-farm productivity came in higher than expected, Unit Labor Costs were lower than expected, and both initial and continuing jobless claims were higher than expected.
We’ve all become painfully aware of the typical “Powell Pattern” on Fed days where the S&P 500 finishes near its lows of the day following an afternoon swoon that seems to always take place right after the Fed President starts speaking. Yesterday, the S&P 500 went in the opposite direction as the Powell pattern was completely reversed.

When the closing bell rang yesterday, the S&P 500 tracking ETF (SPY) was up 1.07% making it the best Fed Day since July 2022 when SPY rallied 2.60%. In the nine meetings between yesterday and July 2022, SPY declined an average of 0.78% on Fed days and was only up three times.

The fact that the market finished higher on a Fed Day yesterday was surprising enough. Even more impressive though was the fact that it finished near its highs for the day. When the closing bell rang, SPY was down 0.2% from its intraday high. That was the closest it finished to an intraday high since the May 2022 meeting, and in the eleven meetings between yesterday and May 2022, SPY’s average close relative to the intraday high was a decline of 1.5%. Did Powell get up on the right side of the bed yesterday?

Sign up for a two-week trial to Bespoke Premium to continue reading more of today’s macro analysis.
The Closer – FOMC, JOLTS, PMIs, Construction Spending – 11/1/23
Log-in here if you’re a member with access to the Closer.
Looking for deeper insight into markets? In tonight’s Closer sent to Bespoke Institutional clients, after a review of tonight’s earnings (page 1), we provide a commentary on today’s FOMC decision (page 2). We then review the day’s economic data including JOLTS (page 3), PMIs (page 4), construction spending (page 5), and petroleum stockpiles (page 5).

See today’s full post-market Closer and everything else Bespoke publishes by starting a 14-day trial to Bespoke Institutional today!
Daily Sector Snapshot — 11/1/23
Chart of the Day – October Sees Some Rotation
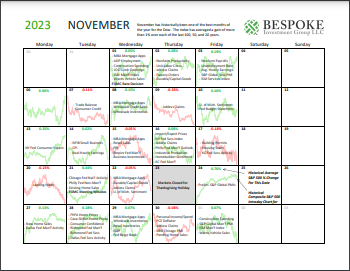
Bespoke Market Calendar — November 2023
Please click the image below to view our November 2023 market calendar. This calendar includes the S&P 500’s historical average percentage change and average intraday chart pattern for each trading day during the upcoming month. It also includes market holidays and options expiration dates plus the dates of key economic indicator releases. Click here to view Bespoke’s premium membership options.
Fixed Income Weekly — 11/1/23
Searching for ways to better understand the fixed income space or looking for actionable ideas in this asset class? Bespoke’s Fixed Income Weekly provides an update on rates and credit each week. We start off with a fresh piece of analysis driven by what’s in the headlines or driving the market in a given week. We then provide charts of how US Treasury futures and rates are trading, before moving on to a summary of recent fixed-income ETF performance, short-term interest rates including money market funds, and a trade idea. We summarize changes and recent developments for a variety of yield curves (UST, bund, Eurodollar, US breakeven inflation, and Bespoke’s Global Yield Curve) before finishing with a review of recent UST yield curve changes, spread changes for major credit products and international bonds, and 1-year return profiles for a cross-section of the fixed income world.

Our Fixed Income Weekly helps investors stay on top of fixed-income markets and gain new perspectives on the developments in interest rates. You can sign up for a Bespoke research trial below to see this week’s report and everything else Bespoke publishes for the next two weeks!
Click here and start a 14-day free trial to Bespoke Institutional to see our newest Fixed Income Weekly now!