Chart of the Day – Bond Yields Collapse
Bespoke’s Morning Lineup – 11/2/23 – Was it Something He Said?
See what’s driving market performance around the world in today’s Morning Lineup. Bespoke’s Morning Lineup is the best way to start your trading day. Read it now by starting a two-week trial to Bespoke Premium. CLICK HERE to learn more and start your trial.
“Once you consent to some concession, you can never cancel it and put things back the way they are.” – Howard Hughes

Start a two-week trial to Bespoke Premium now to get full access to the Morning Lineup.
Stocks are poised to trade higher for the fourth day in a row this morning continuing the positive momentum from yesterday’s trading and a strong session in Europe. Movement in the fixed-income space is also helping as the 10-year yield drops below 4.70%. There’s still a lot of economic data to get through today, and after what has already been a busy day of earnings, there’s still a ton of reports after the close including the biggest of them all – Apple (AAPL) – after the close today. On the economic calendar, we just got a slug of data. Non-farm productivity came in higher than expected, Unit Labor Costs were lower than expected, and both initial and continuing jobless claims were higher than expected.
We’ve all become painfully aware of the typical “Powell Pattern” on Fed days where the S&P 500 finishes near its lows of the day following an afternoon swoon that seems to always take place right after the Fed President starts speaking. Yesterday, the S&P 500 went in the opposite direction as the Powell pattern was completely reversed.

When the closing bell rang yesterday, the S&P 500 tracking ETF (SPY) was up 1.07% making it the best Fed Day since July 2022 when SPY rallied 2.60%. In the nine meetings between yesterday and July 2022, SPY declined an average of 0.78% on Fed days and was only up three times.

The fact that the market finished higher on a Fed Day yesterday was surprising enough. Even more impressive though was the fact that it finished near its highs for the day. When the closing bell rang, SPY was down 0.2% from its intraday high. That was the closest it finished to an intraday high since the May 2022 meeting, and in the eleven meetings between yesterday and May 2022, SPY’s average close relative to the intraday high was a decline of 1.5%. Did Powell get up on the right side of the bed yesterday?

Sign up for a two-week trial to Bespoke Premium to continue reading more of today’s macro analysis.
The Closer – FOMC, JOLTS, PMIs, Construction Spending – 11/1/23
Log-in here if you’re a member with access to the Closer.
Looking for deeper insight into markets? In tonight’s Closer sent to Bespoke Institutional clients, after a review of tonight’s earnings (page 1), we provide a commentary on today’s FOMC decision (page 2). We then review the day’s economic data including JOLTS (page 3), PMIs (page 4), construction spending (page 5), and petroleum stockpiles (page 5).

See today’s full post-market Closer and everything else Bespoke publishes by starting a 14-day trial to Bespoke Institutional today!
Daily Sector Snapshot — 11/1/23
Chart of the Day – October Sees Some Rotation
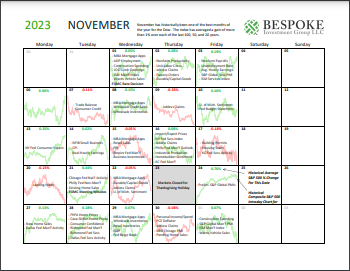
Bespoke Market Calendar — November 2023
Please click the image below to view our November 2023 market calendar. This calendar includes the S&P 500’s historical average percentage change and average intraday chart pattern for each trading day during the upcoming month. It also includes market holidays and options expiration dates plus the dates of key economic indicator releases. Click here to view Bespoke’s premium membership options.
Fixed Income Weekly — 11/1/23
Searching for ways to better understand the fixed income space or looking for actionable ideas in this asset class? Bespoke’s Fixed Income Weekly provides an update on rates and credit each week. We start off with a fresh piece of analysis driven by what’s in the headlines or driving the market in a given week. We then provide charts of how US Treasury futures and rates are trading, before moving on to a summary of recent fixed-income ETF performance, short-term interest rates including money market funds, and a trade idea. We summarize changes and recent developments for a variety of yield curves (UST, bund, Eurodollar, US breakeven inflation, and Bespoke’s Global Yield Curve) before finishing with a review of recent UST yield curve changes, spread changes for major credit products and international bonds, and 1-year return profiles for a cross-section of the fixed income world.

Our Fixed Income Weekly helps investors stay on top of fixed-income markets and gain new perspectives on the developments in interest rates. You can sign up for a Bespoke research trial below to see this week’s report and everything else Bespoke publishes for the next two weeks!
Click here and start a 14-day free trial to Bespoke Institutional to see our newest Fixed Income Weekly now!
Bespoke’s Morning Lineup – 11/1/23 – A Work of Stagnation
See what’s driving market performance around the world in today’s Morning Lineup. Bespoke’s Morning Lineup is the best way to start your trading day. Read it now by starting a two-week trial to Bespoke Premium. CLICK HERE to learn more and start your trial.
“If you knew how much work went into it, you wouldn’t call it genius.” – Michelangelo Buonarroti
Start a two-week trial to Bespoke Premium now to get full access to the Morning Lineup.
A 2.4% rally overnight in Japan hasn’t been enough to help the picture for US futures this morning, but we have seen some improvement following a slightly weaker-than-expected ADP report and the refunding announcement from the US Treasury. It’s a busy day of economic ahead with Construction Spending, JOLTS, and ISM Manufacturing. Then, at 2 PM we’ll get the interest rate decision from the FOMC. While the market is all but certain that there will be no change in rates, you never know what Powell will say at 2:30. Once we get through all of that, we’ll get earnings from Apple (AAPL) after the bell.
In yesterday’s Chart of the Day, we discussed the “Nowhere Nasdaq” as the index is basically unchanged since the start of 2021 – a period just two months short of three years! The S&P 500 has fared modestly better during this span, but overall returns have been, at best, ordinary.
The chart below shows the annualized performance of the S&P 500 on a total return basis over the last one, two, five, ten, and twenty years (green bars) and compares those returns to the long-term historical average (blue bars). Outside of the five- and ten-year time windows, returns through the end of October have been weaker than average with the weakest results over the last two years (-3% vs 10.6%). Over the last twenty years, the S&P 500’s average annualized return of 9.3% is 1.6 percentage points below the long-term average, and while that doesn’t sound like much, it adds up over time. For example, $100 invested 20 years ago that compounded at 9.3% is worth $592 today while that same $100 compounded at 10.9% would be worth $792 today.

As ‘meh’ as equity returns have been over time, they blow the returns of long-term US Treasuries out of the water. The BofA 10+ Year US Treasury Index has now had negative 1-year rolling total returns for a record 33 straight months.

Sign up for a two-week trial to Bespoke Premium to continue reading more of today’s macro analysis.
The Closer – LatAm FX, ECI, Homeowners – 10/31/23
Log-in here if you’re a member with access to the Closer.
Looking for deeper insight into markets? In tonight’s Closer sent to Bespoke Institutional clients, we begin with a review of the latest earnings and Latin American FX (page 1). We then dive into today’s Employment Cost Index data (page 2) as well as a look at quarterly housing vacancy and homeownership rates and housing prices (page 3 and 4). We finish with a review of the stocks that most impacts the S&P 500 in October (page 5).

See today’s full post-market Closer and everything else Bespoke publishes by starting a 14-day trial to Bespoke Institutional today!