Daily Sector Snapshot — 3/3/23
February 2023 Headlines
Bespoke’s Morning Lineup – 3/3/23 – Three Was Enough?
See what’s driving market performance around the world in today’s Morning Lineup. Bespoke’s Morning Lineup is the best way to start your trading day. Read it now by starting a two-week trial to Bespoke Premium. CLICK HERE to learn more and start your trial.
“For the execution of the journey to the Indies I did not make use of intelligence, mathematics or maps.” – Christopher Columbus
Below is a snippet of content from today’s Morning Lineup for Bespoke Premium members. Start a two-week trial to Bespoke Premium now to access the full report.
After three weeks of declines, it was looking like March would only add to the tally. Thursday’s rally pushed the S&P 500 into positive territory for the week, though, and with futures indicated higher now, equities are on pace for a positive week…if they can get through today. It’s a relatively quiet day on the economic calendar today with PMIs for the services sector, the only reports scheduled for release. These are important indicators to watch for signs of whether or not the economy is running too hot, and the international versions of these reports released this morning showed strength. January’s economic data fed a narrative that the economy just wouldn’t quit even as the Fed tried its best to squash it. This week’s data for February like Consumer Confidence, Chicago PMI, and ISM Manufacturing, though, weren’t exactly positive, and they all missed expectations.
One area of the markets not rallying this morning is crypto. After a 50% rally through its high over Presidents’ Day weekend, bitcoin has been correcting for the last two weeks capped off with a 4%+ decline in early trading today. After today’s drop, the pullback is close to 10%, and bitcoin is on pace to close below its 50-day moving average (DMA) for the first time in nearly two months.

A break below the 50-DMA is typically considered a bearish signal, but in bitcoin’s case, this type of pattern hasn’t been followed by a clear trend. During the parabolic runup from 2016 through 2017, any time bitcoin closed below its 50-day moving average after trading above it for at least 50 days it almost always immediately recovered to new highs. Beginning in 2018, though, bitcoin was slower to recover following these types of breaks. In three of the four periods since the start of 2018, prices experienced pretty sizable pullbacks at least in the short term, but they were still always followed by new highs. In dollar terms, last year’s pullback in bitcoin was unlike any other, but in percentage terms, it has been in this type of situation before. As bitcoin has ‘matured’ it has tended to follow more typical technical patterns versus the early days when all it did was win, so a pause in this year’s rally, at least in the short-term, wouldn’t be surprising.

Our Morning Lineup keeps readers on top of earnings data, economic news, global headlines, and market internals. We’re biased (of course!), but we think it’s the best and most helpful pre-market report in existence!
Start a two-week trial to Bespoke Premium to read today’s full Morning Lineup.
The Bespoke 50 Growth Stocks — 3/2/23
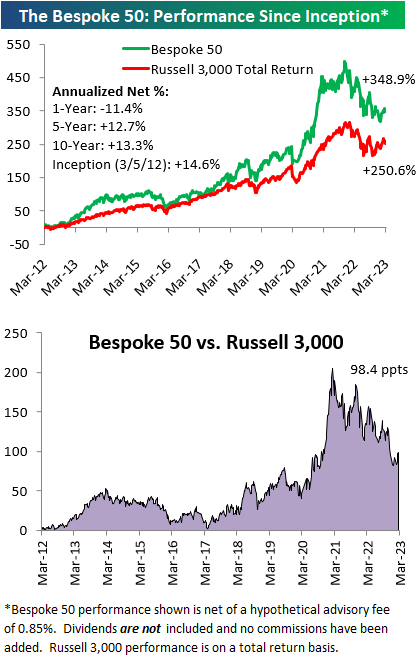
The “Bespoke 50” is a basket of noteworthy growth stocks in the Russell 3,000. To make the list, a stock must have strong earnings growth prospects along with an attractive price chart based on Bespoke’s analysis. The Bespoke 50 is updated weekly on Thursday unless otherwise noted. There were three changes to the list this week.
The Bespoke 50 is available with a Bespoke Premium subscription or a Bespoke Institutional subscription. You can learn more about our subscription offerings at our Membership Options page, or simply start a two-week trial at our sign-up page.
The Bespoke 50 performance chart shown does not represent actual investment results. The Bespoke 50 is updated weekly on Thursday. Performance is based on equally weighting each of the 50 stocks (2% each) and is calculated using each stock’s opening price as of Friday morning each week. Entry prices and exit prices used for stocks that are added or removed from the Bespoke 50 are based on Friday’s opening price. Any potential commissions, brokerage fees, or dividends are not included in the Bespoke 50 performance calculation, but the performance shown is net of a hypothetical annual advisory fee of 0.85%. Performance tracking for the Bespoke 50 and the Russell 3,000 total return index begins on March 5th, 2012 when the Bespoke 50 was first published. Past performance is not a guarantee of future results. The Bespoke 50 is meant to be an idea generator for investors and not a recommendation to buy or sell any specific securities. It is not personalized advice because it in no way takes into account an investor’s individual needs. As always, investors should conduct their own research when buying or selling individual securities. Click here to read our full disclosure on hypothetical performance tracking. Bespoke representatives or wealth management clients may have positions in securities discussed or mentioned in its published content.
The Closer – Factor Fudging, Auto Sales, Openings, Realtors – 3/2/23
Log-in here if you’re a member with access to the Closer.
Looking for deeper insight into markets? In tonight’s Closer sent to Bespoke Institutional clients, following recaps of today’s market moving Fedspeak, we run through the major earnings reports out after the closing bell (page 1). We then check in on various factors’ performance since the October lows (page 2). Turning to macro data, we then look at the latest vehicle sales figures from around the world (page 3) followed by US job postings from Indeed.com (page 4 and 5) before closing with a look at February housing inventory data from Realtor.com (page 6).
See today’s full post-market Closer and everything else Bespoke publishes by starting a 14-day trial to Bespoke Institutional today!
Bespoke’s Weekly Sector Snapshot — 3/2/23
Sentiment Back to Bearish
The consistency of declines throughout February and to start the month of March has sent sentiment decisively lower. The latest data from the American Association of Individual Investors (AAII) showed 23.4% of respondents reported as bullish, up modestly from 21.6% last week but still down significantly from 34.1% two weeks ago. With less than a quarter of respondents reporting as bullish, bullish sentiment continues to sit firmly below its historical average of 37.5% for a record 67 straight weeks.
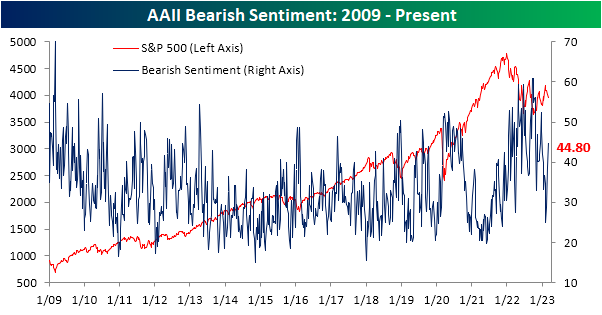
Meanwhile, bearish sentiment has continued to grind higher reaching 44.8% after three straight weeks of increases and hitting the highest level of the short year so far.
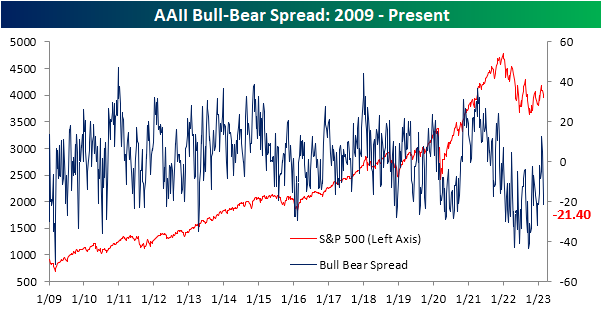
At the start of February, the bull-bear spread ended its record streak of negative readings as bulls finally outnumbered bears. The surge in pessimism in the past couple of weeks, though, has resulted in more negative bull-bear readings.
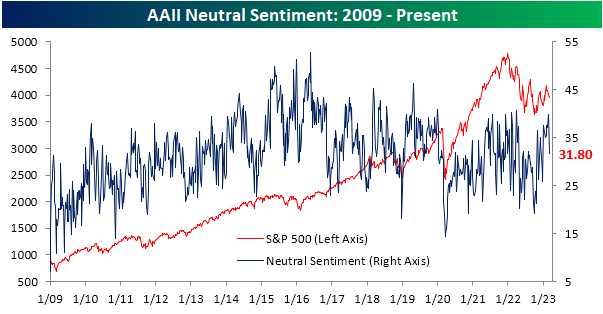
In addition to sentiment taking a more bearish tone, far fewer respondents are reporting neutral sentiment. After the highest reading in nearly a year last week, only 31.8% couldn’t make up their mind this week. That eight percentage point drop from last week was the largest weekly decline since November.
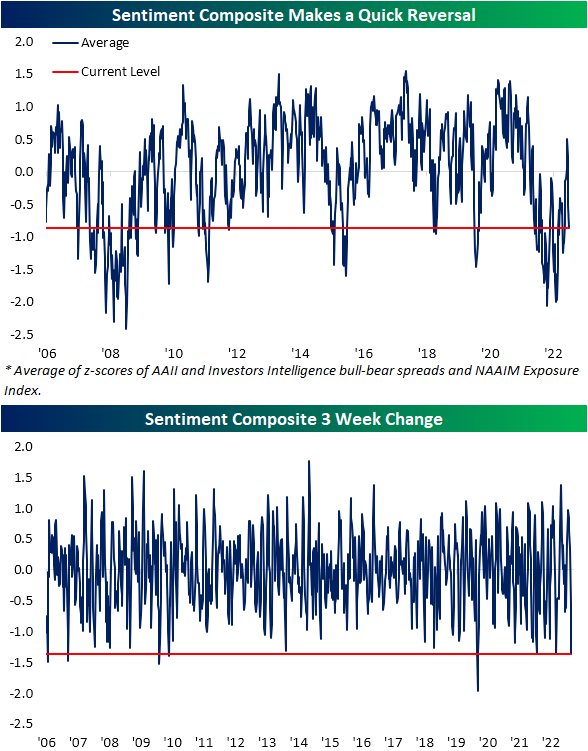
In addition to the AAII survey, other weekly sentiment readings have likewise made a quick reversal back towards negative sentiment. Combining the readings of the AAII survey with the Investors Intelligence survey and the NAAIM Exposure Index, sentiment has gone from the most cheery outlook in over a year down to pessimism right in line with the rest of the past year. In fact, the 1.36 point decline since the high three weeks ago ranks as the seventh largest decline in such a span since the composite begins in 2006.
Since sentiment is a contrarian indicator, the sharp bearish turn across these sentiment indicators ‘should’ be a signal for positive forward performance. However, that has not exactly been the case historically. In the table below, we show each prior week that the index has fallen at least 1.25 points without having done so in the prior three months. Of the dozen prior instances, performance has been mixed going forward. Click here to learn more about Bespoke’s premium stock market research service.
Home Prices Falling Fast
Updated data on home prices across the country came out earlier this week when the newest monthly S&P CoreLogic Case Shiller indices were published. This data is lagged by two months, but it gives us a look at where home prices ended the year in 2022.
Below is a table highlighting the month-over-month (m/m) and year-over-year (y/y) percentage change in home prices across the 20 cities tracked by Case Shiller. It also includes the national and composite 10-city and 20-city readings.
Home prices fell sharply from November 2022 to December 2022, with the national index down 0.81% and 11 of 20 cities down more than 1% sequentially. New York and Miami saw the smallest m/m declines with drops of less than 0.3%.
Looking at y/y price changes, while the national index still showed an increase of 5.76% from December 2021 to December 2022, two cities have now seen prices dip into the red on a y/y basis. Seattle home prices fell 1.78% for the full year 2022, while San Francisco prices fell even more at -4.19%. Given the unrelenting pullback in prices over the last six months, we’ll see more and more cities dip into the red on a y/y basis over the next few months.
Where home price trends get interesting is looking at the post-COVID action. In the aftermath of lockdowns, government stimulus, and the shift to “work from home” in many parts of the labor force, home prices across the country absolutely soared. By mid-2022, the national home price index was up 45% from the level it was at in February 2020 just before COVID hit. Areas on the West Coast and in the Southeast saw prices rise even more, with many cities seeing gains of more than 60% at their peaks.
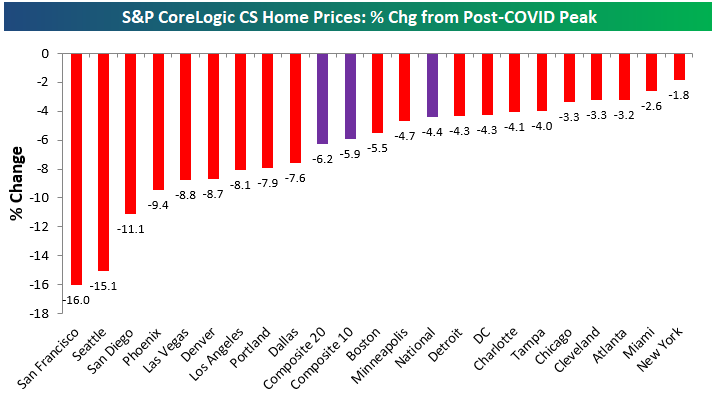
Prices finally peaked last summer, however, as rate hikes by the inflation-fighting Fed quickly pushed mortgage rates to levels not seen in decades. Below is a chart showing how much home prices have fallen from their post-COVID peaks seen in mid-2022. The composite indices are only down 4-6% from their highs, but we’ve seen prices really take a hit out west with cities like San Diego, Seattle, and San Francisco already down double-digit percentage points.
Given the pullbacks in home prices over the past six+ months, below is a look at where prices currently stand relative to their pre-COVID levels at the end of February 2020. Notably, San Francisco — which has seen prices fall the most from their highs — is currently up the least since COVID hit with a gain of 23%. Other cities where home prices are up less post-COVID than the national indices include Minneapolis, DC, Chicago, and Portland. Where home prices are still up the most is in Florida as prices in Tampa and Miami are still up 60% or more. Click here to learn more about Bespoke’s daily premium service.
Another Week Below 200K For Claims
Initial jobless claims continue to impress with this week’s reading being the seventh week in a row of sub-200K prints. Falling another 2K week over week to 190K, adjusted claims are now at the lowest level since the last week of January.
While the seasonally adjusted number is low, before taking that into account claims have actually yet to drop below 200K. Claims are falling as is normal for this point of the year with the past couple of weeks historically being some of the most consistent to experience week-over-week declines on a historical basis. At current levels, claims are comparable to the equivalent week of the year from the past several years excluding 2021.
As for continuing claims, the past couple of weeks have seen the readings begin to pivot lower after rising to the highest level of the year at the start of February. Continuing claims totaled 1.655 million which is the lowest level since the week of 1/21. Albeit claims remain off their best levels of the pandemic (for both initial and continuing claims), they remain healthy headed into next week’s nonfarm payrolls release. Click here to learn more about Bespoke’s premium stock market research service.

