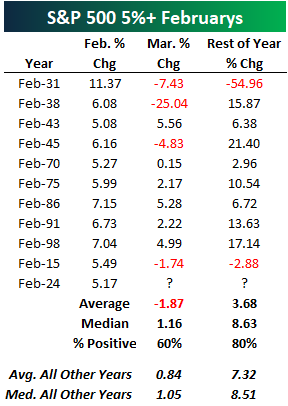
A 5% February: What Worked and What Didn’t
The S&P 500 finished February with a gain of more than 5% for just the 11th time in the index’s history since 1928. Below is a look at prior 5%+ gains in February along with the S&P 500’s performance in March and for the remainder of each year. The last time we had a 5% February was 2015. That March, the S&P fell 1.74%, and the index fell 2.88% from the end of February through year-end. Let’s hope we don’t see that type of action for the remainder of 2024, although a repeat of 2015 would be a lot better than what investors experienced in 1931 when the S&P rallied 11.37% in February only to fall 54.96% for the rest of the year!
Below is a look at our key ETF performance matrix highlighting total returns across asset classes in February, year-to-date, and year-over-year. Mid-cap growth (IJK) was the best area of US markets in February with a 9.58% gain. Dividend stocks (DVY) were the weakest area with a gain of just 1.16% during the month. Looking at sectors, Consumer Discretionary (XLY), Industrials (XLI), and Materials (XLB) actually performed the best in February, beating out Tech’s (XLK) gain of just 4.7% even though the semis (SMH) were up 14%.
Outside of the US, China (ASHR) finally had a big month along with Israel (EIS), which gained 8.6%. Mexico (EWW) and Spain (EWP) were the only two country ETFs that fell in February.
Natural gas (UNG) once again fell sharply, adding to its year-over-year decline of more than 50%. Finally, fixed income ETFs were broadly lower in February, led down by the 20+ Year Treasury ETF (TLT).

Within the S&P 500, there are 67 stocks that show up in at least one of eight “AI” ETFs traded here in the US. As shown below, the 67 “AI” stocks in the S&P were up an average of 5.7% in February compared to a gain of 3.6% for the 433 non-AI stocks. On the year, the 67 “AI” stocks are up 5.9% versus a gain of 2.6% for the non-AI stocks. Given how much some of the most well-known AI names like NVIDIA (NVDA) are up so far in 2024, it’s surprising to us that there isn’t even more separation in performance between the AI and non-AI groups.


The Closer – AI Basket Debut, Dell AI, Ludicrous List – 2/29/24
Log-in here if you’re a member with access to the Closer.
Looking for deeper insight into markets? In tonight’s Closer sent to Bespoke Institutional clients, we review the AI boosted earnings of Dell (DELL) as well as today’s personal income and spending figures (page 1). Next, we debut our newest basket of stocks all about AI (pages 2 and 3). We then show the rise in the number of stocks with big gains and high multiples (pages 4 and 5). We finish by recapping today’s PCE data (pages 6 and 7).

See today’s full post-market Closer and everything else Bespoke publishes by starting a 14-day trial to Bespoke Institutional today!
Bespoke’s Weekly Sector Snapshot — 2/29/24
Bespoke’s Matrix of Economic Indicators – 2/29/24
Our Matrix of Economic Indicators provides a concise summary analysis of the US economy’s momentum. We combine trends across the dozens and dozens of economic indicators in various categories like manufacturing, employment, housing, the consumer, and inflation to provide a directional overview of the economy.
To access our newest Matrix of Economic Indicators, start a two-week free trial to either Bespoke Premium or Bespoke Institutional now!

Chart of the Day – Beware The Ides of March
Earnings Rundown: 2/29/24
Bespoke’s Morning Lineup — 2/29/24
See what’s driving market performance around the world in today’s Morning Lineup. Bespoke’s Morning Lineup is the best way to start your trading day. Read it now by starting a two-week trial to Bespoke Premium. CLICK HERE to learn more and start your trial.
“We must walk consciously only part way toward our goal, and then leap in the dark to our success.” – Henry David Thoreau

Below is a snippet of commentary from today’s Morning Lineup. Start a two-week trial to Bespoke Premium to view the full report.
When looking at the market’s longer-term trend, we like to use a chart of the S&P 500’s 200-day moving average on its own with the daily price changes removed from the chart completely in order to eliminate the day-to-day noise and smooth the trend out. What’s notable here is that the S&P’s 200-day just recently took out its prior all-time high made in early 2022, ending a streak of 460 trading days without a new all-time high for the 200-DMA. While the S&P made a new all-time high on its daily price chart back in January, a new all-time high for the smoothed out 200-DMA is yet another confirmation of the current bull that has been legging higher for the last month or so.


For more analysis of global equities and economic readings released this morning, read today’s full Morning Lineup with a two-week Bespoke Premium trial.
The Closer – Crypto Flows, Fedspeak, KISS Stocks – 2/28/24
Log-in here if you’re a member with access to the Closer.
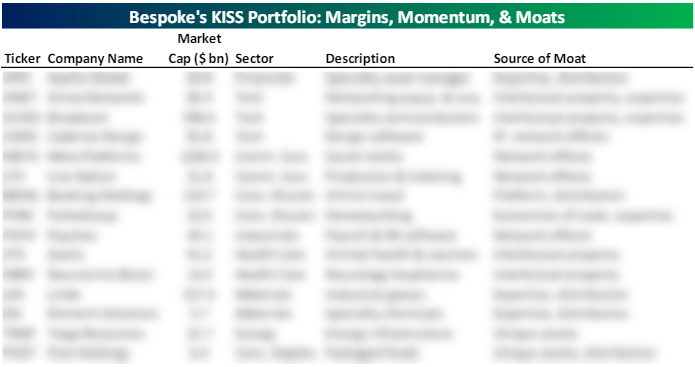
Looking for deeper insight into markets? In tonight’s Closer sent to Bespoke Institutional clients, we begin with a look at the fund flows for the newly debuted Bitcoin ETFs. We also provide a check up on Fedspeak (page 1). Afterward, we debut our basket of stocks created using the philosophy of “keep it simple, stupid” (page 2). We close out with a rundown of the latest EIA data (page 3).
See today’s full post-market Closer and everything else Bespoke publishes by starting a 14-day trial to Bespoke Institutional today!