Bespoke Market Calendar — February 2024
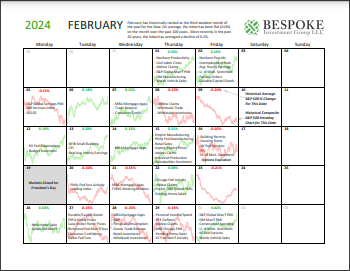
Please click the image below to view our February 2024 market calendar. This calendar includes the S&P 500’s historical average percentage change and average intraday chart pattern for each trading day during the upcoming month. It also includes market holidays and options expiration dates plus the dates of key economic indicator releases. Click here to view Bespoke’s premium membership options.
The Bespoke 50 Growth Stocks — 2/1/24
The “Bespoke 50” is a basket of noteworthy growth stocks in the Russell 3,000. To make the list, a stock must have strong earnings growth prospects along with an attractive price chart based on Bespoke’s analysis. There were 21 changes to the list this week.
The Bespoke 50 is available with a Bespoke Premium subscription or a Bespoke Institutional subscription. With Bespoke Premium, you’ll receive a number of daily market updates from us along with our weekly newsletter and a portion of our investor tools. With Bespoke Institutional, you’ll receive everything that’s included with Premium plus additional daily macro analysis and more stock-specific research.
To see all 50 stocks that currently make up the Bespoke 50, simply start a two-week trial to Bespoke Premium or Bespoke Institutional.

The Bespoke 50 performance chart shown does not represent actual investment results. The Bespoke 50 is updated weekly on Thursday unless otherwise noted. Performance is based on equally weighting each of the 50 stocks (2% each) and is calculated using each stock’s opening price as of Friday morning each week. Entry prices and exit prices used for stocks that are added or removed from the Bespoke 50 are based on Friday’s opening price. Any potential commissions, brokerage fees, or dividends are not included in the Bespoke 50 performance calculation, but the performance shown is net of a hypothetical annual advisory fee of 0.85%. Performance tracking for the Bespoke 50 and the Russell 3,000 total return index begins on March 5th, 2012 when the Bespoke 50 was first published. Past performance is not a guarantee of future results. The Bespoke 50 is meant to be an idea generator for investors and not a recommendation to buy or sell any specific securities. It is not personalized advice because it in no way takes into account an investor’s individual needs. As always, investors should conduct their own research when buying or selling individual securities. Click here to read our full disclosure on hypothetical performance tracking. Bespoke representatives or wealth management clients may have positions in securities discussed or mentioned in its published content.
Chart of the Day – Sahm Rule for Stocks
High Share Prices vs. Low Share Prices
It shouldn’t matter, but we saw a huge disparity in the performance of stocks with high versus low share prices in January. Here are the numbers:
As shown below, in the large-cap Russell 1,000, the 100 stocks that began 2024 with the lowest share prices fell an average of 7.4% in January, while the 100 stocks that began the year with the highest share prices rose an average of 2%.

There are 25 stocks in the Russell 1,000 that began 2024 with a sub-$10 share price, and these stocks fell an average of 11% in January. Conversely, the 41 stocks in the Russell 1,000 that began the year with a share price of more than $500 rose an average of 3.2% during the month.
What gives?


Bespoke’s Morning Lineup – 2/1/24 – Getting Back on the Horse
See what’s driving market performance around the world in today’s Morning Lineup. Bespoke’s Morning Lineup is the best way to start your trading day. Read it now by starting a two-week trial to Bespoke Premium. CLICK HERE to learn more and start your trial.
“Alexander Hamilton started the U.S. Treasury with nothing, and that was the closest our country has ever been to being even.” – Will Rogers

Below is a snippet of commentary from today’s Morning Lineup. Start a two-week trial to Bespoke Premium to view the full report.
Futures are higher this morning as investors look to regroup following yesterday’s FOMC meeting and Powell’s press conference which pooh-poohed the possibility of a March cut. The S&P 500 finished the day down over 1.5% in what was the worst day in four months. Powell gets much of the blame for the decline, but equities were already firmly in the red leading up to the announcement, and the market was also trading at overbought levels. Powell didn’t help, but what he said wasn’t exactly a major surprise. Just the fact that the chair was openly talking about rate cuts being a matter of when rather than if is a stark difference from the last two years.
The tone right now is positive, but if you think Tuesday was a seminal moment in the earnings season, today promises to be even bigger with Apple (AAPL), Amazon (AMZN), and Meta (META) being just three of the dozens of companies reporting after the close.
On the economic calendar, Jobless Claims, Unit Labor Costs, and Non-Farm Productivity were all just released, and later we’ll get Construction Spending as well as the S&P and ISM Manufacturing PMIs. Non-Farm Productivity came in stronger than expected (3.2% vs 2.5%) while Unit Labor Costs were weaker than forecasts (0.5% vs 1.2%). Jobless claims weren’t particularly good as both initial and continuing claims came in higher than expected and at their highest levels since November. Expectations for the PMIs aren’t particularly positive, and based on the regional Fed Manufacturing reports we got throughout the month, we’ll be lucky to even get an inline reading.
What had been a very strong first month of the year turned into a more modest one as Fed Chair Powell successfully let some of the air out of the market balloon in his press conference yesterday. When the dust settled, the S&P 500 finished January up 1.7% on a total return basis after being up well over 3% heading into yesterday’s session.
On a y/y basis, the S&P 500 is still up over 20% on a total return basis which is nine full percentage points above the long-term historical average of 11.8% ranking the last year in the 69th percentile relative to all one-year periods. While one-year returns have been very strong, two-year returns have been the complete opposite. At 5.3% annualized, the S&P 500’s two-year performance ranks in just the 28th percentile relative to all other two-year periods. Looking further out, both five and ten-year annualized returns have been above the historical norm while 20-year returns are still below their long-term average.

Long-term US Treasuries are a completely different story. Based on returns of the BofA/Merrill 10+ Year US Treasury Index, long-term treasuries were down 1.65%. You may recall that in December treasuries ended a 34-month streak of negative 12-month returns, but January’s weakness moved the one-year returns back below zero. As shown in the chart below, annualized returns over the last one, two, and five years are all negative. On a 10 and 20-year basis, returns are positive, but they are still well below their historical long-term average, and for all periods except the last year, current returns rank in the 3rd percentile or below relative to all other periods. Calling the last decade a dark age for bonds wouldn’t be an understatement.

Sign up for a two-week trial to Bespoke Premium to continue reading more of today’s macro analysis.
January 2024 Key ETF Performance
The first month of 2024 is already complete, and below is a look at the performance of various asset classes during January using key ETFs that we track closely. The S&P 500 (SPY) finished the month up 1.59% even though the average stock in the index was down 0.84%. While large-cap ETFs like SPY and QQQ finished the month higher, the small-cap Russell 2,000 (IWM) was down 3.9%.
At the sector level, Real Estate (XLRE) and Consumer Discretionary (XLY) both fell 4%+, while Communication Services (XLC) saw the biggest move to the upside at 4.4%. International equity ETFs were all over the place in January with India (PIN) and Japan (EWJ) solidly higher and China (ASHR) and Hong Kong (EWH) sharply lower. Oil (USO) was actually the best performing area of the entire matrix in January with a gain of 6.4%. On the flip side, natural gas (UNG) and silver (SLV) both fell 3%+.

Start a complimentary 30-day trial to Bespoke Premium today!
The Closer – Fed Confidence, Net New Highs Go For Three, EIA – 1/31/24
Log-in here if you’re a member with access to the Closer.
Looking for deeper insight into markets? In tonight’s Closer sent to Bespoke Institutional clients, we start out with commentary regarding the FOMC decision and market reaction (page 1) followed by a look at the streak of positive readings in S&P 500 net new highs (page 2). We then review the latest earnings reports (page 3) before shifting over to Latin American central banking (page 4). We finish with looks into a bunch of EIA data (pages 5 and 6).

See today’s full post-market Closer and everything else Bespoke publishes by starting a 14-day trial to Bespoke Institutional today!
Daily Sector Snapshot — 1/31/24
Chart of the Day: Shorts, Small Cap, and Last Year’s Losers Lag
Down at Noon on a Fed Day
The first Fed day of the year has arrived. While there’s widespread agreement that rates will be held steady today, according to the CME’s FedWatch tool, markets are pricing higher probabilities of cuts at other meetings this year. Looking six months out shows the market is giving a greater than 50% chance of rates being cut by at least a full percentage point from the current range of 5.25-5.50%. While time will tell what Powell and company decide, we would note that price action of the S&P 500 intraday on all Fed days since 1994 (when the FOMC first began announcing its decision on the same days as the meeting) when the FOMC holds rates steady has historically been less volatile, particularly post-decision, than when rates are cut or raised.

We would also note that the S&P 500 is currently trading lower by 0.86% as of this writing today in the wake of poorly received mega-cap earnings of Alphabet (GOOGL) and Microsoft (MSFT). While those drags on the market are independent of the Fed, that negative tone could lead to the first decline on a Fed day since the September meeting. As shown below, the meetings of the past couple of months have offered a positive change in tone after the S&P 500 largely fell on Fed days throughout late 2022 and 2023.

Not only have the past couple of meetings seen a more positive response from the S&P 500 but the moves have been particularly pronounced in afternoon trading. Below we show the intraday path of the S&P 500 on recent Fed days. The past two meetings (November and December) have resulted in gains of over 1% by the end of the day. However, in a stark difference to other recent meetings, the bulk of those gains have come from strong afternoon rallies in the wake of the decision. As shown by the red line below, the average if the prior ten meetings (those occurring from July 2022 through this past September) saw the S&P 500 trade higher throughout the session up until the final hour of trading when it gave up the ghost and closed at the lows of the day.

Looking back through all Fed days since 1994 when the FOMC began to announce its decisions on the same day of the meeting, there have been 14 times in which the S&P 500 was down by 0.5% or more by noon. Below we have constructed an intraday composite of those days. While the S&P has tended towards weakness throughout most of the session, it has experienced a rally, eating into those losses post-decision. That being said, the gains were not enough to erase all of the pre-announcement declines and the rally tended to be short-lived. Of those 14 days when the S&P 500 was down 0.5% or more by noon, it only closed higher on the day five times.
