Sturdy Sentiment
With the S&P 500 pulling back in the past week, sentiment has likewise taken a less optimistic tone. This week’s AAII sentiment survey showed 42.2% of respondents report as bullish compared to 49% one week ago. Although that is lower, the bullish reading is still well above the historical average of 37.6% and is only at its lowest level since the end of January.

While sentiment currently holds a bullish bias, things are not exactly extreme. For example, back in December more than half of respondents reported as bullish and the current level of bulls only ranks in the 69th percentile of all weeks on record. What is perhaps more impressive is how consistently sentiment has stood at bullish levels. As shown below, over the past four months 87.5% of weeks have seen bullish sentiment come in above 40%. Such consistency of this level of bullishness has not been observed since April and May of 2021. Prior to that, you’d have to go back to January 2015 to find as elevated of a reading.

Meanwhile, bearish sentiment ticked up from 22.6% last week to 26.8% this week. That is the highest reading in a month, but inverse to bullish sentiment, it remains well below the historical average of 31%.

Given there has been consistent readings of bulls above 40%, there is also an impressive streak for bearish sentiment. This week marked the fifteenth consecutive time that bearish sentiment has come in below 30%. That is currently the longest streak since July 2021, and prior to that, there have only been a handful of other streaks that have lasted as long. There was another 15 week long streak that ended in January 2014 but you’d have to travel back another decade to find the next streak of similar length.


B.I.G. Tips – Retail Sales Break The Streak
Chart of the Day – Single Stock Small Caps
Bespoke’s Morning Lineup – 2/15/24 – Tons of Data
See what’s driving market performance around the world in today’s Morning Lineup. Bespoke’s Morning Lineup is the best way to start your trading day. Read it now by starting a two-week trial to Bespoke Premium. CLICK HERE to learn more and start your trial.
“All truths are easy to understand once they are discovered; the point is to discover them.” – Galileo

Below is a snippet of commentary from today’s Morning Lineup. Start a two-week trial to Bespoke Premium to view the full report.
Before getting to today’s Morning Lineup, we wanted to mention that yesterday we updated our “Best of Breed” basket which you can read about at this link. You can also click here to create a Custom Portfolio of our Best of Breed basket and monitor it over the next three months before our next update scheduled for mid-May.
Futures are higher this morning and yields are lower following a large slug of economic data, and the results were mixed relative to expectations. Retail Sales came in significantly weaker than expected across the board while Import Prices were higher than expected. Jobless claims were mixed relative to expectations with initial claims coming in lower than expected while continuing claims were modestly higher than expected. Finally, both the Empire and Philly Fed regional manufacturing reports were better than expected. The Philly reading wasn’t only better than expected, but it was also positive for the first time since August. Net net, the data was skewed to the weak side, and with that, the 10-year US Treasury yield is back down to 4.20% and has erased most of its gain following Tuesday’s higher-than-expected CPI.
As weak as the US data was, the headlines this morning are all about how the Japanese and UK economies both entered recessions in Q4 with back-to-back negative quarters of GDP. This continues a trend where economists keep talking about how resilient the US economy has been in avoiding a recession while other large economies around the world have. Keep in mind, though, that if they used the same definition of recession for the US that they do for the rest of the world (back-to-back quarters of negative GDP), the US economy already had its recession in the first half of 2022!
The red maple-leaf Canadian flag is one of the most recognizable national symbols in the world. However, we were surprised this morning to learn that it has been the national flag of our neighbor up north for less than 60 years as it was only adopted 59 years ago today on 2/15/1965. What may not surprise you is that the process of adopting a national flag in Canada was a forty-year process that began in 1925. Whether you’re talking about tax legislation, foreign aid, hold time on a call to the IRS, or adopting a national flag, when any government gets involved, get comfortable.
Regarding Canada, we discussed the outperformance of the US relative to the rest of the world in yesterday’s Chart of the Day, and Canada has been no exception on a short or long-term basis. The chart below shows the relative strength of Canada versus the US since the red maple leaf flag was first adopted in 1965. While Canadian stocks outperformed the US up until 1980, it was all downhill from around 1980 through 2000. From roughly 2000 through 2010, Canada rallied relative to the US as oil and other commodities rallied, but since the end of the financial crisis, Canadian stocks have done nothing but trade lower on a relative basis, and just this week hit a record low. While the chart below doesn’t include dividends, on a total returns basis, the S&P/TSX Composite has had an annualized return of roughly 7% since February 1964 versus the S&P 500’s annualized gain of around 10.25%.

Sign up for a two-week trial to Bespoke Premium to continue reading more of today’s macro analysis.
The Closer – Factor Reversal, Best of Breed, EIA – 2/14/24
Log-in here if you’re a member with access to the Closer.
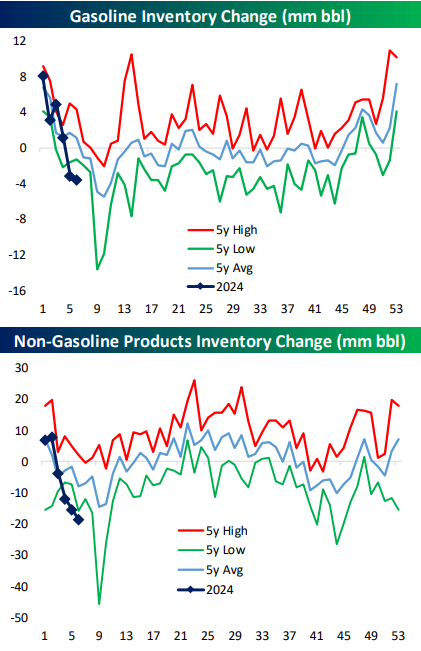
Looking for deeper insight into markets? In tonight’s Closer sent to Bespoke Institutional clients, we begin with a look at the reversal in various factors between yesterday and today (page 1) followed by a look into tonight’s earnings (page 2). We then provide an update of our Best of Breed Basket (pages 2 and 3) before closing with an look into the latest petroleum stockpile data (page 4).
See today’s full post-market Closer and everything else Bespoke publishes by starting a 14-day trial to Bespoke Institutional today!
Daily Sector Snapshot — 2/14/24
A Full Deck for Bitcoin
The price of bitcoin took out its early January high and topped $52,000 for the first time since December 2021 today. Bitcoin’s price traded at a short-term peak in early January just as the ETPs tracking the largest cryptocurrency started trading. From that high on January 11th, prices pulled back over 21% in less than two weeks which, even for bitcoin, is a steep decline in such a short period.

As bitcoin pulled back from that early January high, it looked as though its price would follow a similar path to the one it tracked following other approval milestones. In December 2017, after bitcoin futures launched, prices almost immediately peaked and plunged more than 80%. Then again in October 2021, when the bitcoin futures ETF first launched, prices peaked shortly after once again, resulting in what was ultimately another decline of close to 80%.
As we noted a couple of weeks back, the one difference between the launch of the bitcoin ETPs in January and the other two periods was that while bitcoin’s price was at or right near record highs at each of those prior two points, it was still down over 30% from its all-time high this time around. While “investors” may have been enthusiastic ahead of the launch, the level of excitement was not nearly as strong as it was in late 2017 and late 2021. Even after today’s run to multi-year highs, bitcoin is still more than 25% below its all-time high.

Bespoke Best of Breed Basket Update — February 2024
Chart of the Day: Equal Weight vs. The Rest of the World
Fixed Income Weekly — 2/14/24
Searching for ways to better understand the fixed income space or looking for actionable ideas in this asset class? Bespoke’s Fixed Income Weekly provides an update on rates and credit each week. We start off with a fresh piece of analysis driven by what’s in the headlines or driving the market in a given week. We then provide charts of how US Treasury futures and rates are trading, before moving on to a summary of recent fixed-income ETF performance, short-term interest rates including money market funds, and a trade idea. We summarize changes and recent developments for a variety of yield curves (UST, bund, Eurodollar, US breakeven inflation, and Bespoke’s Global Yield Curve) before finishing with a review of recent UST yield curve changes, spread changes for major credit products and international bonds, and 1-year return profiles for a cross-section of the fixed income world.

Our Fixed Income Weekly helps investors stay on top of fixed-income markets and gain new perspectives on the developments in interest rates. You can sign up for a Bespoke research trial below to see this week’s report and everything else Bespoke publishes for the next two weeks!
Click here and start a 14-day free trial to Bespoke Institutional to see our newest Fixed Income Weekly now!