Bespoke’s Morning Lineup — 2/29/24
See what’s driving market performance around the world in today’s Morning Lineup. Bespoke’s Morning Lineup is the best way to start your trading day. Read it now by starting a two-week trial to Bespoke Premium. CLICK HERE to learn more and start your trial.
“We must walk consciously only part way toward our goal, and then leap in the dark to our success.” – Henry David Thoreau

Below is a snippet of commentary from today’s Morning Lineup. Start a two-week trial to Bespoke Premium to view the full report.
When looking at the market’s longer-term trend, we like to use a chart of the S&P 500’s 200-day moving average on its own with the daily price changes removed from the chart completely in order to eliminate the day-to-day noise and smooth the trend out. What’s notable here is that the S&P’s 200-day just recently took out its prior all-time high made in early 2022, ending a streak of 460 trading days without a new all-time high for the 200-DMA. While the S&P made a new all-time high on its daily price chart back in January, a new all-time high for the smoothed out 200-DMA is yet another confirmation of the current bull that has been legging higher for the last month or so.


For more analysis of global equities and economic readings released this morning, read today’s full Morning Lineup with a two-week Bespoke Premium trial.
The Closer – Crypto Flows, Fedspeak, KISS Stocks – 2/28/24
Log-in here if you’re a member with access to the Closer.
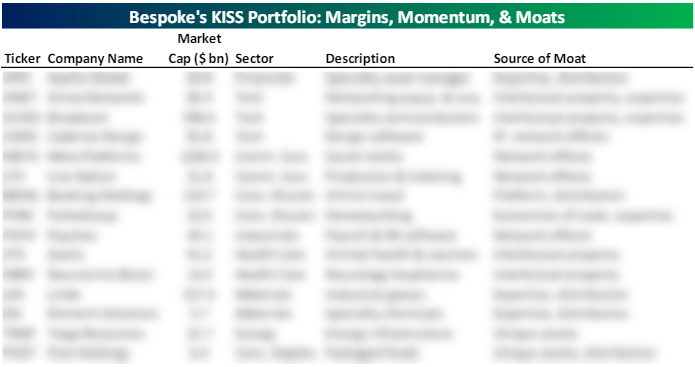
Looking for deeper insight into markets? In tonight’s Closer sent to Bespoke Institutional clients, we begin with a look at the fund flows for the newly debuted Bitcoin ETFs. We also provide a check up on Fedspeak (page 1). Afterward, we debut our basket of stocks created using the philosophy of “keep it simple, stupid” (page 2). We close out with a rundown of the latest EIA data (page 3).
See today’s full post-market Closer and everything else Bespoke publishes by starting a 14-day trial to Bespoke Institutional today!
Daily Sector Snapshot — 2/28/24
Chart of the Day – Bitcoin Tops $60k
Fixed Income Weekly — 2/28/24
Searching for ways to better understand the fixed income space or looking for actionable ideas in this asset class? Bespoke’s Fixed Income Weekly provides an update on rates and credit each week. We start off with a fresh piece of analysis driven by what’s in the headlines or driving the market in a given week. We then provide charts of how US Treasury futures and rates are trading, before moving on to a summary of recent fixed-income ETF performance, short-term interest rates including money market funds, and a trade idea. We summarize changes and recent developments for a variety of yield curves (UST, bund, Eurodollar, US breakeven inflation, and Bespoke’s Global Yield Curve) before finishing with a review of recent UST yield curve changes, spread changes for major credit products and international bonds, and 1-year return profiles for a cross-section of the fixed income world.

Our Fixed Income Weekly helps investors stay on top of fixed-income markets and gain new perspectives on the developments in interest rates. You can sign up for a Bespoke research trial below to see this week’s report and everything else Bespoke publishes for the next two weeks!
Click here and start a 14-day free trial to Bespoke Institutional to see our newest Fixed Income Weekly now!
Beware of February 29th
While we can’t buy more time, tomorrow marks the rare occasion that we’ll get an extra day in a year. Leap years, as they’re known, seem straightforward at first glance – every four years, right? However, there’s a small twist. Typically, a year divisible by four is a leap year, but years ending in ’00 are only leap years if they’re divisible by 400. For example, 2000 qualified as a leap year, but 1700, 1800, and 1900 did not.
Now, let’s look at historical data. Since the New York Stock Exchange adopted the five-day trading week in late 1952, the S&P 500’s average performance on the last trading day of February has been flat, with a median change of 0.00%. However, when the last trading day falls on Leap Day (February 29th), performance has been weaker. The S&P 500’s median performance dips slightly to a decline of 0.13% compared to a small gain of 0.06% on the last trading day of non-leap year Februarys. Interestingly, the last trading day of February, regardless of being a leap year or not, has shown weakness in recent years, experiencing negative returns in each of the past nine years. Whether or not the pattern plays out this year remains to be seen, but even if it does, it would be a small price to pay for an extra day!


Earnings Rundown: 2/28/24
Bespoke’s Morning Lineup – 2/28/24 – US Takes a Breather
See what’s driving market performance around the world in today’s Morning Lineup. Bespoke’s Morning Lineup is the best way to start your trading day. Read it now by starting a two-week trial to Bespoke Premium. CLICK HERE to learn more and start your trial.
“Truth is not determined by a majority vote.” – Pope Benedict XVI
Below is a snippet of commentary from today’s Morning Lineup. Start a two-week trial to Bespoke Premium to view the full report.
After gains in four of the last five days, equity futures were indicated lower ahead of some key GDP and inflation data this morning. Along with lower equity futures, bond yields are also lower, and that is welcome news for the housing market where Mortgage applications fell over 5% last week after falling more than 10% in the week before that.
US stocks have led the way during the recent bull market, especially since the lows of October 2022. The S&P 500 ETF (SPY) has gained 42.2% since then, compared to 31.0% for the rest of the world (iShares MSCI ACWI ex US ETF, ACWX). However, most of this outperformance occurred after late October. As the chart below shows, both SPY and ACWX were performing similarly until then.

Year-to-date, only the Japan ETF (EWJ) has outperformed SPY, with a gain of nearly 8%. However, international markets have shown recent strength. While the S&P 500 gained 2.05% last week, ETFs for China, Germany, Italy, and France all outperformed it. Only India’s ETF declined.

Looking at all ten country ETFs, most are near or at 52-week highs, except China (MCHI). While they haven’t experienced the same rapid ascent as the US (bottom chart), they have still reached significant levels.


For a closer look at how the market performed following prior moves like we saw yesterday, read today’s full Morning Lineup with a two-week Bespoke Premium trial.
The Closer – Fed Pricing, Home Prices, Durables – 2/27/24
Log-in here if you’re a member with access to the Closer.
Looking for deeper insight into markets? In tonight’s Closer sent to Bespoke Institutional clients, we begin with a look into tonight’s earnings as well as the changes to Fed pricing (page 1). We then review the latest Conference Board and Case-Shiller data (page 2) before pivoting over to the latest hard manufacturing data (page 3). We finish with a recap of today’s healthy 7 year note auction (page 4).

See today’s full post-market Closer and everything else Bespoke publishes by starting a 14-day trial to Bespoke Institutional today!