Bespoke’s Morning Lineup – 3/18/24 – Rebound
See what’s driving market performance around the world in today’s Morning Lineup. Bespoke’s Morning Lineup is the best way to start your trading day. Read it now by starting a two-week trial to Bespoke Premium. CLICK HERE to learn more and start your trial.
“Though the people support the government; the government should not support the people.”- Grover Cleveland

Below is a snippet of commentary from today’s Morning Lineup. Start a two-week trial to Bespoke Premium to view the full report.
After a slow week for stocks last week, bulls are running this morning. Overnight, Japan surged 2.7% ahead of a BoJ rate decision tonight, and China rallied 1%. European stocks are only modestly positive in early trading even as the Nasdaq is indicated to open up well over 1% and the S&P 500 is higher by about 0.7%.
It’s going to be a busy week in terms of global monetary policy, including the Fed on Wednesday. The big event for today, though, is Nvidia’s Developer conference which kicks off today with a keynote speech from CEO Jensen Huang today right after the market closes.
Although it may not necessarily seem like it, the S&P 500 and Nasdaq have now both been down for two weeks in a row. In what bulls are hoping will ultimately end up being a pause that refreshes, nearly half of all sectors have moved out of overbought territory, including Technology which was down nearly 1% last week. The sector is still up nearly 7% on the year which puts it in the number five position in terms of year-to-date performance, trailing Energy, Communication Services, Financials, and Industrials.

We touched on this briefly last week, but it’s been a pretty good couple of weeks for commodity-related stocks, and the two leading sectors last week were Energy and Materials with gains of 3.8% and 1.6%, respectively. Both sectors are at or very near ‘extreme’ short-term overbought levels, but from a longer-term perspective, they’ve forged very different paths. As shown in the one-year charts below, while the Materials sector (XLB) has been hitting 52-week highs on a near-daily basis for the last few weeks, the Energy sector is only now starting to test its 52-week highs from last fall. Does the sector still have enough gas in the tank to push through?
Read today’s entire Morning Lineup.

For more analysis of global equities and economic readings released this morning, read today’s full Morning Lineup with a two-week Bespoke Premium trial.
Bespoke’s Brunch Reads – 3/15/24
Welcome to Bespoke Brunch Reads — a linkfest of the favorite things we read over the past week. The links are mostly market-related, but there are some other interesting subjects covered as well. We hope you enjoy the food for thought as a supplement to the research we provide you during the week.
While you’re here, join Bespoke Premium with a 30-day trial!
On This Day in History:
Sláinte!: March 17th marks the death of St. Patrick. Born in Britain around the end of the 4th century, he was kidnapped by Irish raiders when he was in his teens and taken as a slave. He eventually escaped slavery and returned to his family, but then went back to Ireland as a Christian missionary where he helped convert the Irish to Catholicism while building churches, schools, and monasteries across the country. What began as a religious feast day in honor of St. Patrick has become a global celebration of Irish culture and heritage, symbolized by the color green and the three-leaved shamrock that St. Patrick used to explain the Holy Trinity. The first St. Patrick’s Day celebrations were actually in America, specifically when Irish soldiers serving in the English military marched through New York City in 1762. Today in Chicago, the city famously dyes its river green.

Economic Trends
These Kids Made Their Influencer Parents Wealthy. Will They See a Dime of That Money? (Cosmopolitan)
Growing up as a child influencer, Vanessa’s life was intertwined with her mother’s blog and social media ventures, with no financial compensation for her efforts. Despite contributing to her family’s income through brand deals and content creation, Vanessa discovered at 18 that she had no earnings set aside for her. This story discusses the “sharenting” industry, where children’s contributions to family vlogging businesses often go unrewarded. The only state that offers legal protection for child influencers’ earnings is Illinois. [Link]
A waste of time and money (Klement on Investing)
Following “finfluencers,” or financial influencers, might not be such a good idea if you’re taking their investment advice. According to one study, on average, investors following these finfluencers underperformed the market by 0.35% per month, translating to an annualized underperformance of 4.1%. While a minority of top-performing finfluencers outperformed the market significantly, a substantial portion exhibited “antiskill,” meaning their recommendations resulted in statistically significant negative returns. Interestingly, the study found that those with the most followers were more likely to offer poor advice, suggesting that popularity on social media platforms might not correlate with financial acumen. [Link]
YouTube TV Is Thriving in the Cable Replacement Space as a ‘One-Stop Shop’ for Consumers (Yahoo Entertainment)
YouTube has emerged as a formidable contender in the streaming landscape, surpassing major streamers like Netflix in total TV viewing share. With its YouTube TV subscription service, YouTube is also challenging traditional cable giants, boasting 8 million subscribers in 2023, nearly double that of its closest competitor, Hulu + Live TV. Importantly, YouTube has captured loyalty with Millennials and Gen Z as it offers its traditional creator channels alongside its TV options which inlcude live sports like the NFL Sunday Ticket package. With streaming services fighting over channels and popular names that often rotate in and out, viewers have become fed up with the number of services they need to pay for to get everything they want. [Link]
American Debt Stings Like Never Before in New Era for Households (Yahoo Finance)
US families, already strained by inflation, are now grappling with the cost of debt due to rising interest rates. This has led to higher delinquency rates and increased financial burdens. The Federal Reserve’s rate hikes have pushed up the cost of consumer borrowing, intensifying economic pressures on households. This situation affects consumer sentiment and may impact political dynamics, as financial stability becomes a crucial issue for Americans in this election year. The resumption of student loan payments after the pandemic-era pause is another stress point for those who can’t even fund a savings account because they are living paycheck to paycheck. [Link]
IKEA slashes prices on products as transportation and materials costs ease (USA Today)
IKEA is reducing prices on numerous products in various countries and plans further cuts in 2024, due to positive economic developments and cheaper raw materials. This strategy, aimed at making quality design more accessible, follows efforts to decrease operational costs and enhance efficiency. The initiative started in Europe, leading to increased customer numbers and sales. Ingka Group, IKEA’s largest store owner, is investing in these price reductions to adjust prices to pre-pandemic levels by the end of the next year. [Link]
Airlines Want to Stop ‘Travel Hack’ JSX From Luring Rich Flyers Away (Yahoo News)
JSX, a Dallas-based carrier, has revolutionized air travel for business travelers by offering the convenience of a chartered plane at near business class prices, thanks to creative use of regulatory loopholes that involves operating two companies that work together to schedule flights and sell tickets while avoiding the stringent safety and security requirements that apply to larger scheduled flights. JSX now operates nearly 35,000 flights over 48 routes and still maintains a strong safety record. It is also considering expansion into hybrid electric planes. JSX says that bigger airlines are trying to put it out of business as they struggle to recover corporate travelers from the pandemic. [Link]
AI & Technology
Why Walmart’s quick success in generative AI search should have Google worried (CNBC)
Walmart is using AI to transform its app into a comprehensive solution for event planning and therefore reducing the need for multiple online sources or reliance on search engines like Google. Walmart CEO Doug McMillon spoke about the search capability improvements within the retailer’s app thanks to generative AI, which helps customers find exactly what they are looking for more efficiently. Other companies are investing in the technology as well, like “Ask Instacart” which allows users to search by theme rather than specific items. Amazon and Shopify are other examples. This trend has begun to emerge amid Google’s own recent issues with Gemini. [Link]
Doctors using the Apple Vision Pro for surgery is now a thing (Quartz)
If people walking around town wearing the headset wasn’t unsettling enough, at London’s Cromwell Hospital, the $3,500 Apple Vision Pro played a crucial role in two spinal surgeries. The device wasn’t worn by the doctors but by a scrub nurse who utilized it to display virtual screens for selecting tools and tracking the surgery’s progress. This integration of VR technology in surgical procedures, developed in collaboration with eXeX for AI-driven surgical apps, is hailed as game-changing by the medical team. Apple’s Vision Pro is also being used for surgical planning, training, and medical education through apps like myMako, Fundamental Surgery, and Complete HeartX. [Link]
China using AI to run world’s largest high-speed railway system (Interesting Engineering)
China has the largest high-speed rail network in the world, spanning 45,000 kilometers. It’s now using AI. Managed from Beijing, the AI system boasts an accuracy level of 89% and significantly enhances the efficiency and safety of the rail network by processing vast amounts of data in real time, enabling maintenance teams to swiftly address any irregularities. This technological advancement has led to an 80% reduction in minor track faults and eliminated major track irregularity warnings, contributing to the high-speed rail’s status as the fastest in the world. As China aims to extend its high-speed rail to connect all cities with populations over 500,000, the use of AI in rail management will be even more important. [Link]
Health & Wellness
Experimental weight loss pill seems to be more potent than Ozempic (New Scientist)
Weight loss drugs have been a spark plug for stocks like Eli Lilly (LLY) and Novo Nordisk (NVO), the makers of Mounjaro, Zepbound, Ozempic, and Wegovy. Now, an experimental pill called Amycretin has shown promising early trial results, causing significant weight loss—13% over three months. That surpasses the effects of injectable treatments such as the aforementioned. Amycretin mimics both the GLP-1 and amylin hormones, potentially offering a more potent weight loss solution compared to the current options. However, its long-term effectiveness and safety remain to be fully evaluated. The pill form could be particularly appealing for those averse to injections. [Link]
Why the Y chromosome is vanishing and what this means for the future (The Week)
The Y chromosome, essential for determining male sex in humans, has lost the majority of its original genes over millions of years. Unlike the X chromosome, the Y chromosome lacks genetic recombination, which helps eliminate harmful mutations, leading to its rapid degradation. Researchers suggest that if the Y chromosome were to disappear, it could result in the extinction of humans or the emergence of new human species with different sex determination systems. Others say that the Y chromosome has developed characteristics to preserve its function. [Link]
‘Alarming’ rise in Americans with long Covid symptoms (The Guardian)
A CDC survey reveals that 6.8% of American adults are currently experiencing long-Covid symptoms. That’s a big increase and has sounded the alarm among “experts”. Following a major surge in infections, the majority of long Covid sufferers report a significant impact on daily activities. The rise in cases is now estimated at 17.6 million Americans. [Link]
No such thing as ‘long COVID,’ health agency says in shocking claim: ‘Unnecessary fear’ (New York Post)
Contrary to the last article, long Covid doesn’t exist at all. Researchers say that the term instills unnecessary fear and isn’t markedly different from post-viral symptoms of other illnesses like the flu. Their study surveyed over 5,000 individuals, finding no significant difference in the severity of post-viral symptoms between those who tested positive for COVID-19 and those who didn’t, or those who had the flu. The discrepancy between findings in these two articles demonstrates the need for further research into post-viral syndromes. [Link]
Environmental
Where Heat Pumps Win — And Where They Lose (Heatmap News)
Researchers at the National Renewable Energy Lab (NREL) found that heat pumps are a cost-effective option for roughly 65 million U.S. homes, or 60% of the country, even before accounting for subsidies. The study considers various factors including home types, local climates, and energy prices, and determined that heat pumps can lower greenhouse gas emissions immediately in all 48 contiguous US states. However, the up-front costs of high-efficiency heat pumps may be prohibitive for many, regardless of the possibility for long-term utility bill savings. Incentives and advancements in heat pump technology could make these systems more accessible and financially viable for a broader range of households. [Link]
It’s Official: America Is Experiencing a Solar Power Explosion Unmatched in History (Popular Mechanics)
The Solar Energy Industries Association reported that the US added 32.4 gigawatts of solar capacity in 2023, the most in a single year. It also represents 52% of all new energy capacity. This growth was propelled by the Inflation Reduction Act’s clean energy incentives and the completion of delayed projects. Texas and California led the expansion which is expected to continue. [Link]
Privacy & Security
Automakers Are Sharing Consumers’ Driving Behavior With Insurance Companies (NYT)
Kenn Dahl experienced an unexpected 21% increase in his car insurance premium, despite being a careful driver with no accident history. Later he found out that it was because his LexisNexis report, which detailed every trip made in his Chevrolet Bolt over six months, including data on speeding, hard braking, and rapid accelerations, provided by General Motors. Automakers and data brokers collect driving data to offer personalized insurance rates. While some programs are voluntary and require driver consent, concerns have arisen about privacy, the clarity of consent, and the potential for increased insurance costs without explicit knowledge. [Link]
How TikTok Was Blindsided by U.S. Bill That Could Ban It (WSJ)
Despite previous signs of stability, including President Biden himself joining TikTok, behind-the-scenes efforts in Washington were aiming to either ban TikTok or force its sale due to concerns over its Chinese ownership and the perceived risks to national security. The proposed legislation, gaining momentum after concerns over TikTok videos related to the Israel-Hamas conflict, represents the most significant threat to TikTok’s operations in the US to date. TikTok has been mobilizing its user base to push back against the legislation, despite facing backlash from lawmakers for this approach. [Link]
Cities to Cities
Automakers Are Sharing Consumers’ Driving Behavior With Insurance Companies (NYT)
Kenn Dahl experienced an unexpected 21% increase in his car insurance premium, despite being a careful driver with no accident history. Later he found out that it was because his LexisNexis report, which detailed every trip made in his Chevrolet Bolt over six months, including data on speeding, hard braking, and rapid accelerations, provided by General Motors. Automakers and data brokers collect driving data to offer personalized insurance rates. While some programs are voluntary and require driver consent, concerns have arisen about privacy, the clarity of consent, and the potential for increased insurance costs without explicit knowledge. [Link]
How TikTok Was Blindsided by U.S. Bill That Could Ban It (WSJ)
Despite previous signs of stability, including President Biden himself joining TikTok, behind-the-scenes efforts in Washington were aiming to either ban TikTok or force its sale due to concerns over its Chinese ownership and the perceived risks to national security. The proposed legislation, gaining momentum after concerns over TikTok videos related to the Israel-Hamas conflict, represents the most significant threat to TikTok’s operations in the US to date. TikTok has been mobilizing its user base to push back against the legislation, despite facing backlash from lawmakers for this approach. [Link]
Read Bespoke’s most actionable market research by joining Bespoke Premium today! Get started here.
Have a great weekend!
The Bespoke Report — 3/15/24 — Inflation Pops, NVDA Drops
To read our weekly Bespoke Report newsletter and access everything else Bespoke’s research platform has to offer, start a two-week trial to Bespoke Premium.


Daily Sector Snapshot — 3/15/24
Rotation
Investors have been waiting for a broadening out of the rally for even longer than they’ve been pricing in (and then pricing out) rate cuts, but while breadth may still be relatively narrow, there has been a good deal of rotation recently.
Let’s start with where the market stood heading into today. We measure overbought and oversold levels as a closing price that is one or more standard deviations above (below) the 50-day moving average (DMA). By that measure, the S&P 500 closed at overbought levels for 40 straight days through the close on 3/14. While that sounds extreme, we would note that in the period ending on August 1st of last year, the S&P 500 closed at overbought levels for 45 straight days in what was the ‘summer of overbought’.

Now let’s get to the part about rotation. While the S&P 500 has been overbought for the last 40 trading days, not a single sector has closed at overbought levels for as many days. As shown in the chart below, the streak for the Financials sector has been close at 39, followed by Industrials at 30 days. After those two sectors, no other sector has closed at overbought levels for even half as long as the S&P 500. To put that in perspective, since daily sector price data starts in late 1989, there have been eleven other periods where the S&P 500 closed at overbought levels for at least 40 trading days, and of those periods, there was only one (in 2012) in which not a single sector had seen 40 or more overbought straight closes on the same day that the S&P 500 reached 40.


Bespoke’s Morning Lineup – 3/15/24 – Busy Day to End the Week
See what’s driving market performance around the world in today’s Morning Lineup. Bespoke’s Morning Lineup is the best way to start your trading day. Read it now by starting a two-week trial to Bespoke Premium. CLICK HERE to learn more and start your trial.
“If you can’t explain it to a six-year old, you don’t understand it yourself.” – Albert Einstein
Below is a snippet of commentary from today’s Morning Lineup. Start a two-week trial to Bespoke Premium to view the full report.
Were yesterday’s stronger-than-expected inflation data and weaker retail sales the catalyst to kick off a more significant pullback, or will the dip buyers step back in once again and take us to new highs? This morning’s economic news isn’t helping matters. While Import Prices were in line with forecasts, the New York Fed’s Empire Manufacturing report came in significantly weaker than expected as the headline index dropped to negative 20.9 versus forecasts for a reading of negative 7.0. Within the report, both the Prices Paid and Prices Received components also rose, so that’s not a particularly encouraging sign, even if this report has been notoriously volatile over time.
Futures have pulled back modestly following the reports. While the S&P 500 and Dow are still indicated to open higher, the Nasdaq is modestly lower following some weak earnings after the close on Thursday. The most notable of those was Adobe (ADBE). The stock is trading down over 11% in the pre-market and on pace for its fourth most negative reaction to earnings in the last 20+ years.
It may look like a chart of an AI stock and its name does have the letters “AI” (in reverse order), but the Materials sector has been on fire for the last two months.

Barring a decline of over 1.4% today, the sector will have its eighth straight weekly gain. That would rank as the longest weekly winning streak since May 2009 and just the sixth winning streak of eight or more weeks in the sector’s history dating back to 1990. That streak in May 2009 was also the only streak that stretched beyond eight weeks.
Read today’s entire Morning Lineup.

For more analysis of global equities and economic readings released this morning, read today’s full Morning Lineup with a two-week Bespoke Premium trial.
The Closer – Central Bank Preview, PPI, Materials Marching – 3/14/24
Log-in here if you’re a member with access to the Closer.
Looking for deeper insight into markets? In tonight’s Closer sent to Bespoke Institutional clients, we begin with a preview of the multiple upcoming central bank decisions (page 1) followed by a review of today’s PPI data (page 2). We then finish with a look into the uncommon and significant outperformance of the Materials sector (page 3).

See today’s full post-market Closer and everything else Bespoke publishes by starting a 14-day trial to Bespoke Institutional today!
Bespoke’s Weekly Sector Snapshot — 3/14/24
Chart of the Day – Clean Energy’s Collapse: Three Years Later
Q4 2023 Earnings Conference Call Recaps
Bespoke’s Conference Call Recaps provide helpful summaries of corporate conference calls throughout earnings season. We go through the conference calls of some of the most important companies in the market and summarize key topics covered by management. These recaps include information regarding each company’s financial results, growth by segment, as well as some aspects of the business that management expects to impact future results. We also identify trends emerging for the broader economy in these recaps.
Bespoke’s Conference Call Recaps are available at the Bespoke Institutional level only. You can sign up for Bespoke Institutional now and receive a 14-day trial to read our newest Conference Call recaps. To sign up, choose either the monthly or annual checkout link below:
Bespoke Institutional – Monthly Payment Plan
Bespoke Institutional – Annual Payment Plan
Below is a list of the Conference Call Recaps published during the Q4 2023 and Q3 2023 earnings reporting periods.
Q4 2023 Recaps:
Williams Sonoma: Q4 2023

Nordstrom: Q4 2023

AeroVironment: Q3 2024

Aaron’s: Q4 2023

NVIDIA: Q4 2024

Walmart: Q4 2024

Home Depot: Q4 2023

Deere: Q4 2023

Generac: Q4 2023

Airbnb: Q4 2023

AutoNation: Q4 2023

Restaurant Brands International: Q4 2023

Shopify: Q4 2023

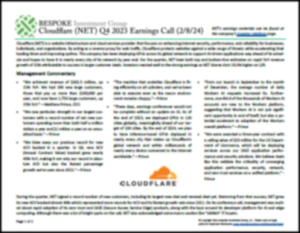
Cloudflare: Q4 2023
Hershey: Q4 2023

Disney: Q1 2024

Arm: Q3 2024

Uber: Q4 2023

Chipotle: Q4 2023

Spotify: Q4 2023

Simon Property: Q4 2023

Palantir: Q4 2023

Caterpillar: Q4 2023

McDonald’s: Q4 2023

Apple: Q1 2024

Amazon: Q4 2023

Meta Platforms: Q4 2023

Honeywell: Q4 2023

Old Dominion Freight: Q4 2023

Starbucks: Q1 2024

Microsoft: Q2 2024

United Parcel Service: Q4 2023

Alphabet: Q4 2023

Whirlpool: Q4 2023

Super Micro Computer: Q2 2024

Norfolk Southern: Q4 2023

American Express: Q4 2023

IBM: Q4 2023

Tesla: Q4 2023

ASML: Q2 2024

Texas Instruments: Q4 2023

Netflix: Q4 2023

RTX: Q4 2023

3M: Q4 2023

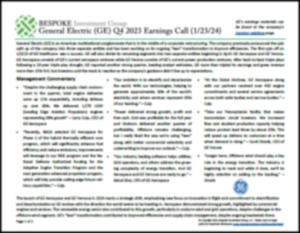
General Electric: Q4 2023
Schlumberger: Q4 2023

PPG Industries: Q4 2023

Taiwan Semiconductor: Q4 2023

H.B. Fuller: Q4 2023

Fastenal: Q4 2023

Big Banks (JPM, C, BAC, GS): Q4 2023

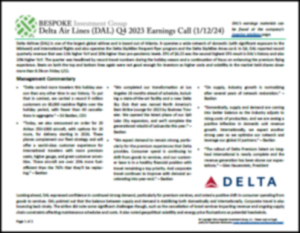
Delta Air Lines: Q4 2024
Constellation Brands: Q3 2024

Conagra Brands: Q2 2024

Lamb Weston: Q2 2024

Walgreens: Q1 2024

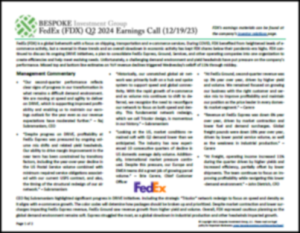
FedEx: Q2 2024
Costco: Q1 2024

Brown-Forman: Q2 2024

SentinelOne: Q3 2024

Q3 2023 Recaps:
Deere: Q4 2023
Dick’s Sporting Goods: Q3 2024
Walmart: Q3 2024
Target: Q3 2024
Home Depot: Q3 2024
Tyson Foods: Q4 2023
Kelly Services: Q3 2023
Stride: Q1 2024
Eaton: Q3 2023
Caterpillar: Q3 2023
McDonald’s: Q3 2023
Ford: Q3 2023
Amazon: Q3 2023
Meta: Q3 2023
General Dynamics: Q3 2023
Microsoft: Q1 2024
Alphabet: Q3 2023
Spotify: Q3 2023
3M: Q3 2023
Autoliv: Q3 2023
Tesla: Q3 2023
Netflix: Q3 2023
JB Hunt: Q3 2023
Lockheed Martin: Q3 2023
Big Banks (JPM, C, BAC, GS): Q3 2023
Delta Air Lines: Q3 2023
PepsiCo: Q3 2023
Conagra Brands: Q1 2024
Lamb Weston: Q1 2024
Nike: Q1 2024
Costco: Q4 2023
MillerKnoll: Q1 2024
FedEx: Q1 2024
AutoZone: Q4 2023
Lennar: Q3 2023
Dave & Buster’s: Q2 2023
AeroVironment: Q1 2024
Recaps published during Q1 2023 are available with a Bespoke Institutional subscription.