Chart of the Day: Gold Versus Rates
Bespoke’s Weekly Sector Snapshot — 4/6/23
Zillow the Go-To in Online Real Estate Search
Yesterday we published a note on the most recent results from our Bespoke Consumer Pulse survey that we conduct on 1,500 US consumers each month (with demographics balanced to census numbers). In regards to real estate and housing, one of the many questions we ask consumers is what their favorite website/app is to search for real estate. When it comes to searching for houses, there’s Zillow and then there’s everyone else. As shown below, 48.3% of respondents said that Zillow is their favorite website/app for searching for real estate. Realtor.com ranks second all the way down at 15.6%. While Zillow’s popularity in our survey dipped somewhat in late 2019 and 2020, it has been trending steadily higher since mid-2021 and just hit new survey highs (since 2014) this month.
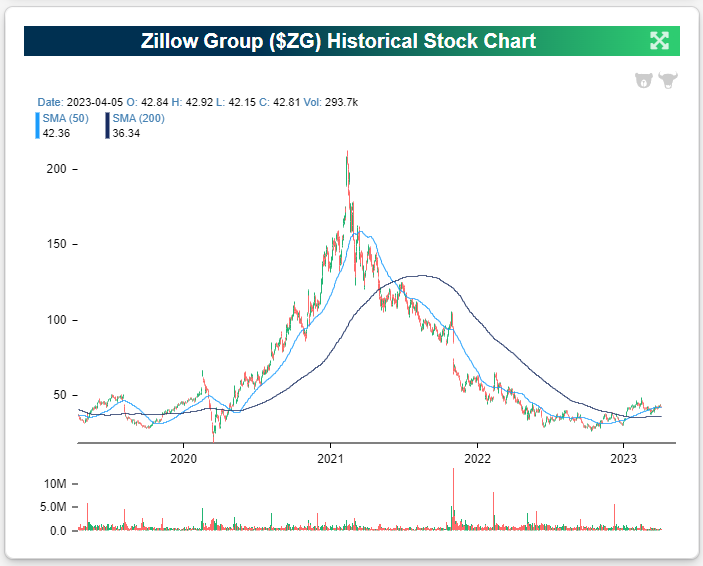
While Zillow’s popularity with US consumers hit a record high in our survey this month, the company’s share price certainly hasn’t followed this trend. Since the end of 2020, shares of Zillow (ZG) are down 67%, and they’re down 16.5% over the last five years. Of course, in between we saw shares explode higher by more than 600% from their post-COVID lows in March 2020 to their highs in early 2021:
The shorter-term chart for ZG looks quite different, though, with a series of higher highs and higher lows since shares bottomed last October.
Check out our full Consumer Pulse Report here if you’re interested in the latest consumer trends across the economy.
Have you tried Bespoke All Access yet?
Bespoke’s All Access research package is quick-hitting, actionable, and easily digestible. Bespoke’s unique data points and analysis help investors better visualize underlying market trends to ultimately make more informed investment decisions.
Our daily research consists of a pre-market note, a post-market note, and our Chart of the Day. These three daily reports are supplemented with additional research pieces covering ETFs and asset allocation trends, global macro analysis, earnings and conference call analysis, market breadth and internals, economic indicator databases, growth and dividend income stock baskets, and unique interactive trading tools.
Click here to sign up for a one-month trial to Bespoke All Access, or you can read even more about Bespoke All Access here.
Claims Get Revised
Jobless claims were in focus this morning as seasonally adjusted initial claims were surprisingly high at 228K versus expectations of 200K. Previously, adjusted claims had consistently come in well below 200K with 10 readings below that level in the last 11 weeks. However, that large increase in the most recent week’s data was matched with large revisions to the past couple of years’ data as the BLS updated its seasonal adjustment methodology. The net impact of those changes was to redistribute claims throughout the year, revising up readings from Q1 and Q4 while Q2 and Q3 were revised down; total or average annual readings were not changed. As discussed in greater detail on the BLS website and we will review in more depth in tonight’s Closer, there are two methods for seasonal adjustment: multiplicative or additive. Most of the time the claims data has used multiplicative seasonal factoring, but periods like the first year of the pandemic in which the indicator experiences unusually large level increases means an additive approach becomes more apt. This week, the BLS applied a new hybrid approach with additive factoring applied from early March 2020 through mid-2021 and multiplicative factoring for all other periods.
As shown below, that change back to multiplicative factoring resulted in some large revisions for initial claims over the past couple of years. In turn, that has dramatically changed the picture jobless claims have painted. Previously (red line in chart below) claims had been more or less trending sideways after bottoming around a year ago, but after these revisions (blue line) claims are trending upwards and bottomed this past September. In addition, the upward revision to 247K to the print from two weeks ago would mark the highest level since January 2022.
As for the non-seasonally adjusted data, the story is much less noisy being unaffected by the aforementioned revisions. In other words, the overall picture for claims hasn’t changed when looking at this series. Claims remain near historically healthy levels consistent with the few years prior to the pandemic. Granted, those are off the strongest readings from last year. At this point of the year, claims are also trending lower as could be expected based on seasonal patterns. The next couple of weeks may see claims move higher because of seasonality, though, that would likely prove to be a temporary bump in the road with claims resuming the trend lower through the late spring.
The revision likewise impacted continuing claims which rose to 1.823 million in the most recent week. That brings claims back up to the highest levels since December 2021 as they have risen sequentially for three weeks in a row.

Have you tried Bespoke All Access yet?
Bespoke’s All Access research package is quick-hitting, actionable, and easily digestible. Bespoke’s unique data points and analysis help investors better visualize underlying market trends to ultimately make more informed investment decisions.
Our daily research consists of a pre-market note, a post-market note, and our Chart of the Day. These three daily reports are supplemented with additional research pieces covering ETFs and asset allocation trends, global macro analysis, earnings and conference call analysis, market breadth and internals, economic indicator databases, growth and dividend income stock baskets, and unique interactive trading tools.
Click here to sign up for a one-month trial to Bespoke All Access, or you can read even more about Bespoke All Access here.

Sentiment Back to Bullish
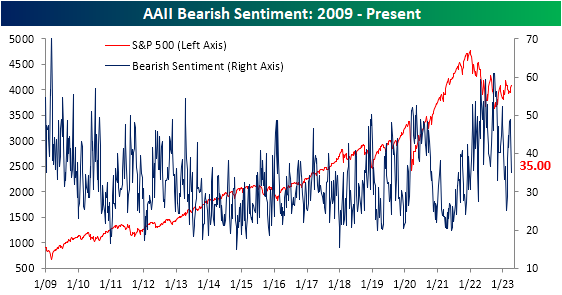
Sentiment saw a huge rebound this week based on the latest AAII survey. With the S&P 500 taking out early March highs late last week, bullish sentiment jumped 10.8 percentage points to 33.3%. Although there was a higher level of bullish sentiment as recently as February 16th, this week’s increase was the largest WoW jump since June of last year. Even though a double-digit jump in bullish sentiment sounds significant, S&P 500 performance has been unremarkable following similar instances historically.
The rise in bullish sentiment borrowed almost entirely from those reporting as bearish. Bearish sentiment fell 10.6 percentage points down to 35%. That is the lowest reading since mid-February and the first double-digit drop since November.
The huge shift in favor of bulls this week resulted in the bull-bear spread narrowing to -1.7 points. That is the least negative reading in the spread since February when the bull-bear spread had broken a record streak of bearish readings.
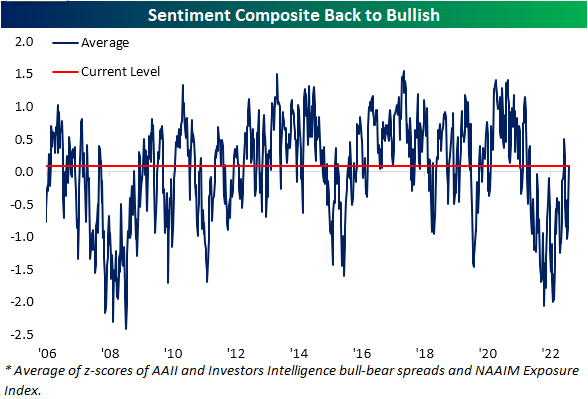
As we noted last week, the AAII survey has been a holdout in showing more optimistic sentiment readings. Whereas other sentiment surveys like the NAAIM exposure index and the Investors Intelligence survey had essentially returned to historical averages, the AAII survey saw firmly bearish sentiment readings with a bull-bear spread of 1.6 standard deviations from its historical average as of last week. Given the quick turnaround this week, the AAII survey is no longer weighing on our Sentiment Composite as it moved back into positive territory indicating bullish sentiment for only the fourth week since the start of 2022.

Have you tried Bespoke All Access yet?
Bespoke’s All Access research package is quick-hitting, actionable, and easily digestible. Bespoke’s unique data points and analysis help investors better visualize underlying market trends to ultimately make more informed investment decisions.
Our daily research consists of a pre-market note, a post-market note, and our Chart of the Day. These three daily reports are supplemented with additional research pieces covering ETFs and asset allocation trends, global macro analysis, earnings and conference call analysis, market breadth and internals, economic indicator databases, growth and dividend income stock baskets, and unique interactive trading tools.
Click here to sign up for a one-month trial to Bespoke All Access, or you can read even more about Bespoke All Access here.

Bespoke’s Morning Lineup – 4/6/23 – Quiet Heading Into The Weekend
See what’s driving market performance around the world in today’s Morning Lineup. Bespoke’s Morning Lineup is the best way to start your trading day. Read it now by starting a two-week trial to Bespoke Premium. CLICK HERE to learn more and start your trial.
“If you want to make enemies, try to change something.” – Woodrow Wilson
Below is a snippet of content from today’s Morning Lineup for Bespoke Premium members. Start a two-week trial to Bespoke Premium now to access the full report.
It hasn’t been an especially good week for economic data so far with notable weakness in employment-related data. Besides the JOLTS and ADP reports which were weaker than expected, the employment component of the ISM Manufacturing report was the lowest in over two years while the employment component of the Services report declined relative to February and is barely clinging to positive territory. Initial Jobless Claims were also just released and came in at 228K relative to expectations for 200K. Continuing Claims were 1.823 mln versus forecasts for 1.7 mln. Initial Claims were the highest since last December while Continuing Claims were the highest since December 2021 So, you can add more weak employment data to this week’s pile. In reaction to the report, futures saw a modest tick lower but nothing major.
All of these indicators are a sideshow, though. Tomorrow’s Non-Farm Payrolls report will either confirm the weakness we have seen in these indicators or render them irrelevant (for a few days at least). Unfortunately, the equity market will be closed for the main event in observance of Good Friday. Bond markets will be open, and lately, they’ve been more volatile than the stock market anyway, so don’t think there won’t be any fireworks. And if that isn’t enough for you, crypto never sleeps!
Open or closed tomorrow, we’ll be watching to see if another epic streak can continue or come to an end. Monthly Non-Farm Payrolls have come in better than expected for eleven straight months, so a better-than-expected report would make it a full year. Never before has the been a streak that long or for that matter even half as long.

Our Morning Lineup keeps readers on top of earnings data, economic news, global headlines, and market internals. We’re biased (of course!), but we think it’s the best and most helpful pre-market report in existence!
Start a two-week trial to Bespoke Premium to read today’s full Morning Lineup.
The Closer – Data Whiff Continues – 4/6/23
Log-in here if you’re a member with access to the Closer.
Looking for deeper insight into markets? In tonight’s Closer sent to Bespoke Institutional clients, we begin with a look at Western Alliance (WAL) outflows and the surge into money market funds (page 1). Next, we dive into the Dallas Fed’s bank survey (page 2) and Citi Economic Surprise indices (page 3). We then update non-manufacturing PMIs (page 4), Indeed job postings numbers (pages 5 and 6), and petroleum inventories (page 7).
See today’s full post-market Closer and everything else Bespoke publishes by starting a 14-day trial to Bespoke Institutional today!
Daily Sector Snapshot — 4/5/23
Chart of the Day – The Streak Ends
Fixed Income Weekly: 4/5/23
Searching for ways to better understand the fixed income space or looking for actionable ideas in this asset class? Bespoke’s Fixed Income Weekly provides an update on rates and credit every Wednesday. We start off with a fresh piece of analysis driven by what’s in the headlines or driving the market in a given week. We then provide charts of how US Treasury futures and rates are trading, before moving on to a summary of recent fixed income ETF performance, short-term interest rates including money market funds, and a trade idea. We summarize changes and recent developments for a variety of yield curves (UST, bund, Eurodollar, US breakeven inflation and Bespoke’s Global Yield Curve) before finishing with a review of recent UST yield curve changes, spread changes for major credit products and international bonds, and 1 year return profiles for a cross section of the fixed income world.
In this week’s report, we review the slide in pricing for the Fed’s rate path.
Our Fixed Income Weekly helps investors stay on top of fixed-income markets and gain new perspectives on the developments in interest rates. You can sign up for a Bespoke research trial below to see this week’s report and everything else Bespoke publishes free for the next two weeks!
Click here and start a 14-day free trial to Bespoke Institutional to see our newest Fixed Income Weekly now!


