The Triple Play Report — 4/12/23
An earnings triple play is a stock that reports earnings and manages to 1) beat analyst EPS estimates, 2) beat analyst sales estimates, and 3) raise forward guidance. You can read more about “triple plays” at Investopedia.com where they’ve given Bespoke credit for popularizing the term. We like triple plays as an indication that a company’s business is firing on all cylinders, with above-expectations results and an improving outlook. A triple play is indicative of positive “fundamental momentum” instead of pure fundamentals, and there are always plenty of names with both high and low valuations on our quarterly list.
Bespoke’s Triple Play Report highlights companies that have recently reported earnings triple plays, and it features commentary from management on triple-play conference calls, company descriptions and analysis, and price charts. Bespoke’s Triple Play Report is available at the Bespoke Institutional level only. You can sign up for Bespoke Institutional now and receive a 14-day trial to read this week’s Triple Play Report, which features seven stocks. To sign up, choose either the monthly or annual checkout link below:
Bespoke Institutional – Monthly Payment Plan
Fixed Income Weekly: 4/12/23
Searching for ways to better understand the fixed income space or looking for actionable ideas in this asset class? Bespoke’s Fixed Income Weekly provides an update on rates and credit every Wednesday. We start off with a fresh piece of analysis driven by what’s in the headlines or driving the market in a given week. We then provide charts of how US Treasury futures and rates are trading, before moving on to a summary of recent fixed income ETF performance, short-term interest rates including money market funds, and a trade idea. We summarize changes and recent developments for a variety of yield curves (UST, bund, Eurodollar, US breakeven inflation and Bespoke’s Global Yield Curve) before finishing with a review of recent UST yield curve changes, spread changes for major credit products and international bonds, and 1 year return profiles for a cross section of the fixed income world.
In this week’s report, we discuss shifting regimes in real rates and inflation pricing.
Our Fixed Income Weekly helps investors stay on top of fixed-income markets and gain new perspectives on the developments in interest rates. You can sign up for a Bespoke research trial below to see this week’s report and everything else Bespoke publishes free for the next two weeks!
Click here and start a 14-day free trial to Bespoke Institutional to see our newest Fixed Income Weekly now!
Chart of the Day: Earnings Seasonality and Triple Play Streaks
10-Year 10-Baggers
Peter Lynch’s 1989 book One Up On Wall Street introduced investors to the word “ten bagger,” which represents an investment that appreciates by 10x (1,000%) its initial purchase price.
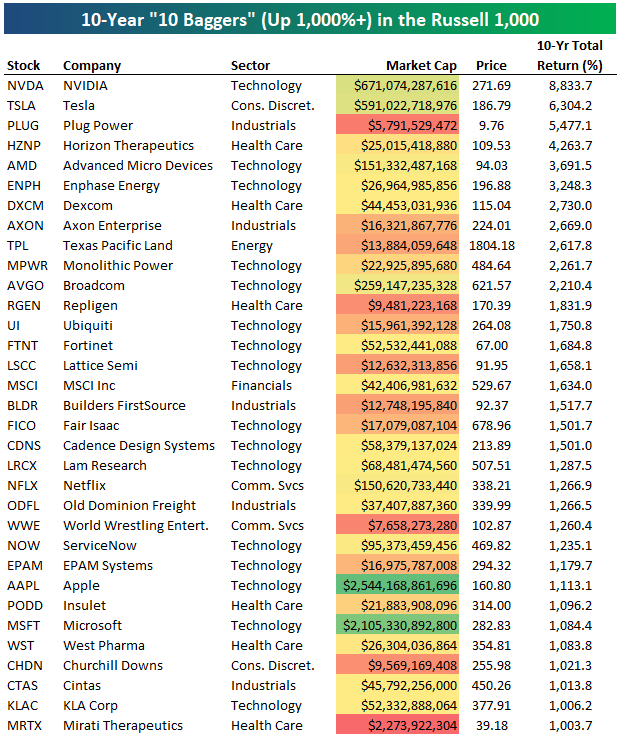
Today we wanted to highlight the stocks that have been “ten baggers” over the last ten years. In the Russell 1,000, 33 names are up more than 1,000% since April 12th, 2013. Over the same 10-year period, the S&P 500 tracking ETF (SPY) is up 211%. As shown below, NVIDIA (NVDA) is up the most with a gain of 8,833%, followed by Tesla (TSLA) at 6,304% and then Plug Power (PLUG) at 5,477%.
There are 16 Technology stocks on the list of 33 ten baggers, which is the most of any sector. Other Tech stocks on the list include AMD, Enphase Energy (ENPH), Broadcom (AVGO), Fortinet (FTNT), Lam Research (LRCX), and even the two largest stocks in the US – Apple (AAPL), and Microsoft (MSFT). Netflix (NFLX) is also another notable on the list with a gain of 1,266%.
Some other notables include Industrials stocks like Axon — the maker of Tasers and police body cameras, Industrials stocks like Builders FirstSource (BLDR) and Old Dominion Freight (ODFL), and Vince VcMahon’s World Wrestling Entertainment (WWE), which is set to be bought by Endeavor Group (EDR).
Stocks that are already up 1,000%+ over the last ten years seem unlikely to repeat that over the next ten years. The obvious next question is: which stocks will be ten baggers over the next ten years? As Peter Lynch instructed, you’ll have to do your research!
Have you tried Bespoke All Access yet?
Bespoke’s All Access research package is quick-hitting, actionable, and easily digestible. Bespoke’s unique data points and analysis help investors better visualize underlying market trends to ultimately make more informed investment decisions.
Our daily research consists of a pre-market note, a post-market note, and our Chart of the Day. These three daily reports are supplemented with additional research pieces covering ETFs and asset allocation trends, global macro analysis, earnings and conference call analysis, market breadth and internals, economic indicator databases, growth and dividend income stock baskets, and unique interactive trading tools.
Click here to sign up for a one-month trial to Bespoke All Access, or you can read even more about Bespoke All Access here.
Bespoke’s Morning Lineup – 4/12/23 – Here it Comes and There it Goes
See what’s driving market performance around the world in today’s Morning Lineup. Bespoke’s Morning Lineup is the best way to start your trading day. Read it now by starting a two-week trial to Bespoke Premium. CLICK HERE to learn more and start your trial.
“Simple can be harder than complex: You have to work hard to get your thinking clean to make it simple.” – Steve Jobs
Below is a snippet of content from today’s Morning Lineup for Bespoke Premium members. Start a two-week trial to Bespoke Premium now to access the full report.
Investors took an optimistic tone heading into the release of March CPI with futures marginally higher. Headline CPI came in at 0.1% m/m which was less than the 0.2% forecast. Core CPI increased by 0.4% which was right in line with forecasts. On a y/y basis, headline CPI was 5.0% versus estimates of 5.1% while core increased by 5.6% which was right in line with consensus forecasts. The immediate response in the futures market was higher equities and much lower yields as the 2-year drops back below 4%.
CPI reports have become increasingly important in the eyes of market commentators in the post-COVID environment. From an outsider’s perspective, you would think that these are the most important days of the month. Looking at the actual data, though, CPI reports may not necessarily be as impactful as you would originally think.
The chart below compares the S&P 500’s median daily percentage change on all market days versus CPI days for three different periods. First, for all days since 2000, the S&P 500’s median daily change is the same for all days versus CPI days (0.55%), so we can consider that the baseline. Since the start of 2020, when COVID first started showing up in the headlines, the S&P 500’s median daily percentage move on all days has been 0.74% versus 0.59% on CPI days. In other words, in the post-COVID world, the S&P 500 has been less volatile on CPI days versus all market days.
Where the stock market has become more volatile on CPI days is since November 2021 when Fed Chair Powell retired the term transitory. From then until now, the S&P 500’s median daily change has increased to 0.88% while on CPI days, it has risen to 0.95%. So, yes CPI reports have taken on an added significance, but they may not be as impactful as you would think from the headlines. CPI day or not, in the post-COVID world and even more so in the post ‘transitory’ world as the Fed aggressively hiked rates, the market has become more volatile on all trading days. This morning, the CPI report is the most important release of the year so far, but by this afternoon, it will have faded well into the rearview mirror.

Our Morning Lineup keeps readers on top of earnings data, economic news, global headlines, and market internals. We’re biased (of course!), but we think it’s the best and most helpful pre-market report in existence!
Start a two-week trial to Bespoke Premium to read today’s full Morning Lineup.
The Closer – Eurozone Megacaps – 4/11/23
Log-in here if you’re a member with access to the Closer.
Looking for deeper insight into markets? In tonight’s Closer sent to Bespoke Institutional clients, we check in on the largest European stocks providing notes on each name in the Euro Stoxx 50 ETF (FEZ) (pages 1 -4). We also recap today’s 3 year note auction.
See today’s full post-market Closer and everything else Bespoke publishes by starting a 14-day trial to Bespoke Institutional today!
Daily Sector Snapshot — 4/11/23
Industry Performance and CPI
Tomorrow’s release of March CPI is expected to show headline inflation cooling to 5.1% on a y/y basis from 6.0% in February. In the table below, we break down the average performance (in basis points) of each of the 24 industry groups in the S&P 500 on days of CPI releases since 2000 based on how the headline reading came in relative to expectations. There have been some notable shifts in reactions among groups to CPI reports in the pre and post-COVID (February 2020) periods. For example, in the pre-COVID period, the three best-performing industry groups on days when CPI was stronger than expected were Real Estate, Banks, and Semis. In the post-COVID period, though, these three industry groups have been among the market’s worst performers on CPI beats with all three averaging one-day declines of at least 69 bps compared to the S&P 500’s average decline of 62 bps. Interestingly, the disparity is a lot less apparent when we compare pre and post-COVID performance on days when CPI is weaker than expected.
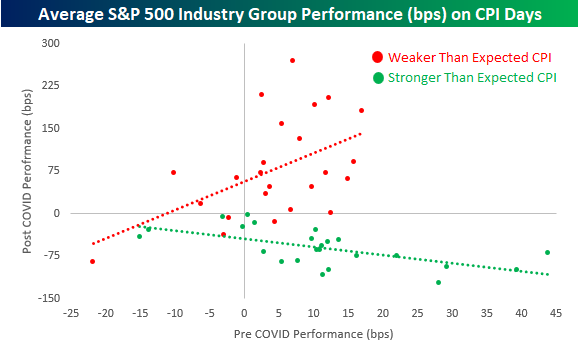
To further illustrate this shift and how it has been much more notable on days when the CPI is stronger than expected, the scatter chart below compares industry group performance on CPI days in the pre and post-COVID periods when the headline reading comes in better and worse than expected. Starting with weaker-than-expected CPI days (red dots and red trendline), the trendline is positively sloped as groups that tended to perform best on weaker-than-expected CPI days are generally still performing the best while the industry groups that lagged on weaker-than-expected CPI days still tend to lag in the post-COVID period. The performance dynamic on stronger-than-expected CPI days (green dots and trendline), however, is the complete opposite as the trendline is negatively sloped indicating that the best-performing groups pre-COVID have tended to be the weakest in the post-COVID period and vice versa.
Have you tried Bespoke All Access yet?
Bespoke’s All Access research package is quick-hitting, actionable, and easily digestible. Bespoke’s unique data points and analysis help investors better visualize underlying market trends to ultimately make more informed investment decisions.
Our daily research consists of a pre-market note, a post-market note, and our Chart of the Day. These three daily reports are supplemented with additional research pieces covering ETFs and asset allocation trends, global macro analysis, earnings and conference call analysis, market breadth and internals, economic indicator databases, growth and dividend income stock baskets, and unique interactive trading tools.
Click here to sign up for a one-month trial to Bespoke All Access, or you can read even more about Bespoke All Access here.


