Bespoke Baskets Update — April 2023
Fixed Income Weekly: 4/19/23
Searching for ways to better understand the fixed income space or looking for actionable ideas in this asset class? Bespoke’s Fixed Income Weekly provides an update on rates and credit every Wednesday. We start off with a fresh piece of analysis driven by what’s in the headlines or driving the market in a given week. We then provide charts of how US Treasury futures and rates are trading, before moving on to a summary of recent fixed income ETF performance, short-term interest rates including money market funds, and a trade idea. We summarize changes and recent developments for a variety of yield curves (UST, bund, Eurodollar, US breakeven inflation and Bespoke’s Global Yield Curve) before finishing with a review of recent UST yield curve changes, spread changes for major credit products and international bonds, and 1 year return profiles for a cross section of the fixed income world.
In this week’s report, we dive in to bank exposure to CRE.
Our Fixed Income Weekly helps investors stay on top of fixed-income markets and gain new perspectives on the developments in interest rates. You can sign up for a Bespoke research trial below to see this week’s report and everything else Bespoke publishes free for the next two weeks!
Click here and start a 14-day free trial to Bespoke Institutional to see our newest Fixed Income Weekly now!
Chart of the Day – Low Volume Rallies
Bespoke’s Morning Lineup – 4/19/23 – Financials and Everyone Else
See what’s driving market performance around the world in today’s Morning Lineup. Bespoke’s Morning Lineup is the best way to start your trading day. Read it now by starting a two-week trial to Bespoke Premium. CLICK HERE to learn more and start your trial.
“If you want to build a ship, don’t drum up the people to gather wood, divide the work, and give orders. Instead, teach them to yearn for the vast and endless sea.” – Reed Hastings
Below is a snippet of content from today’s Morning Lineup for Bespoke Premium members. Start a two-week trial to Bespoke Premium now to access the full report.
Investors and traders are taking a breather this morning as they digest the latest round of earnings results. A higher-than-expected inflation print in the UK has contributed to the negative tone. Gold, oil, and bitcoin are also trading moderately lower as yields rise in what to this point has been a risk-off environment so far this morning.
It’s still early in earnings season, but we wonder if the batch of earnings since yesterday’s close will be a trend. Of the 23 companies reporting earnings since Tuesday’s close, 65% have exceeded EPS forecasts while just 55% have topped sales estimates. Neither of those rates is exceptionally strong, and the 55% revenue beat rate is weak.
Breaking down the numbers a little bit, though, shows an entirely different picture. Of the eight companies that reported weaker-than-expected EPS, all eight of them were from the Financials sector. In other words, ex Financials, the EPS beat rate was 100%. You can’t get much better than that! In terms of sales, the beat rate wasn’t as strong, but it was still 70%. It’s only one day, but if you’re a bear, the wave of weaker results has started to show up in full force- except it has only been evident in one sector. If that weakness remains ringfenced to the Financials, bulls may stay in the driver’s seat.

Our Morning Lineup keeps readers on top of earnings data, economic news, global headlines, and market internals. We’re biased (of course!), but we think it’s the best and most helpful pre-market report in existence!
Start a two-week trial to Bespoke Premium to read today’s full Morning Lineup.
The Closer – Regional Bank Stability, Housing Bottoming? – 4/18/23
Log-in here if you’re a member with access to the Closer.
Looking for deeper insight into markets? In tonight’s Closer sent to Bespoke Institutional clients, we begin report with a look at the earnings of Netflix (NFLX), United Airlines (UAL), and Toronto-Dominion (TD) to name a few (page 1). We then dive into the latest housing data (pages 2 and 3) and check in on homebuilder stocks (page 4). Next, we review the latest services sector survey from the New York Fed (page 5), Canadian CPI (page 6), before closing out with the latest job postings numbers (page 7).
See today’s full post-market Closer and everything else Bespoke publishes by starting a 14-day trial to Bespoke Institutional today!
Daily Sector Snapshot — 4/18/23
Bespoke Stock Scores — 4/18/23
Sector Breadth All Over the Place
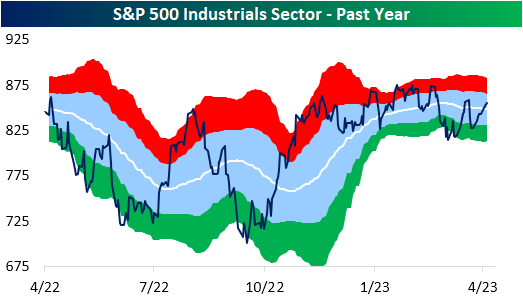
In terms of price, the Industrials sector remains 5.75% below its high from January of last year and has yet to even take out the highs from earlier this year, but breadth has been more constructive recently. Just yesterday, the sector’s cumulative advance/decline line—the cumulative sum of the sector’s daily difference in the number of advancing and declining stocks—hit a new all time high.
Although that measure of breadth is making promising moves, other breadth measures have not exactly echoed that strength. In spite of the record high in the cumulative A/D line Monday, only 37% of the sector’s stocks finished above their 50-DMAs. As shown below, of all other instances of a record high in the cumulative AD line, there has never been such a low reading in the percentage of stocks above their 50-DMAs. In fact, no other readings have even crossed into the 30% range! For the vast majority of previous highs, the percentage of stocks above their 50-DMAs has sat at 70% or more.
All that is to say that most Industrials sector stocks are moving higher, but have not yet moved above potential resistance at their 50-DMAs. And even though the reading on the percentage of stocks above their 50-DMAs is low at the moment, that is not to say it is not improving rapidly. As shown below, it has risen sharply from the low of 19.18% on April 6th. Furthermore, whereas Monday’s close only saw 37% of the sector finish above their 50-DMAs, as of mid-morning Tuesday, the reading is already up another 8.2 percentage points to 45.2% as the average stock in the sector trades just 7 bps below its 50-DMA.
Have you tried Bespoke All Access yet?
Bespoke’s All Access research package is quick-hitting, actionable, and easily digestible. Bespoke’s unique data points and analysis help investors better visualize underlying market trends to ultimately make more informed investment decisions.
Our daily research consists of a pre-market note, a post-market note, and our Chart of the Day. These three daily reports are supplemented with additional research pieces covering ETFs and asset allocation trends, global macro analysis, earnings and conference call analysis, market breadth and internals, economic indicator databases, growth and dividend income stock baskets, and unique interactive trading tools.
Click here to sign up for a one-month trial to Bespoke All Access, or you can read even more about Bespoke All Access here.
Historic Divergence in Tech Price and Breadth
Each day in our Sector Snapshot, we highlight the overbought and oversold readings of each S&P 500 sector based on price and breadth. For price, we consider a sector to be overbought when it trades at least one standard deviation above its 50-DMA and oversold when it is one standard deviation below its 50-DMA. For breadth, we look at the 10-day advance-decline line. Again, when the 10-day A/D line rises at least one standard deviation above its historical average, it can be considered overbought and vice versa.
The Tech sector is in an unusual place in which price has been overbought for the entirety of the past month while short-term breadth has dropped into oversold territory in the past two sessions.
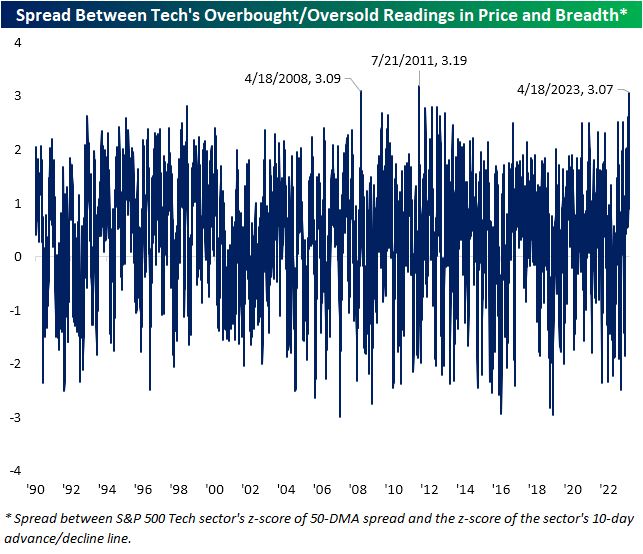
Taking a spread of the two measures, that is nearly a record divergence. As shown below, there have only been two other times in which there has been a three-standard deviation difference between the overbought/oversold levels of price and breadth. The most recent of these was in July 2011 when similar to now, the sector traded over 1.4 standard deviations above its 50-DMA while the 10-day A/D line was over a standard deviation below its historical average. The other instance was exactly 15 years ago in April 2008. That time was slightly different in that price was extremely overbought trading 3 standard deviations above its 50-DMA while breath was neutral and only slightly negative.
Given the Tech sector has managed to perform well on unimpressive breadth, it would imply mega caps are buoying the market cap-weighted index.
Have you tried Bespoke All Access yet?
Bespoke’s All Access research package is quick-hitting, actionable, and easily digestible. Bespoke’s unique data points and analysis help investors better visualize underlying market trends to ultimately make more informed investment decisions.
Our daily research consists of a pre-market note, a post-market note, and our Chart of the Day. These three daily reports are supplemented with additional research pieces covering ETFs and asset allocation trends, global macro analysis, earnings and conference call analysis, market breadth and internals, economic indicator databases, growth and dividend income stock baskets, and unique interactive trading tools.
Click here to sign up for a one-month trial to Bespoke All Access, or you can read even more about Bespoke All Access here.


