April 2026 Headlines
Matrix of Economic Indicators – 5/5/26
Our Matrix of Economic Indicators provides a concise summary analysis of the US economy’s momentum. We combine trends across the dozens and dozens of economic indicators in various categories like manufacturing, employment, housing, the consumer, and inflation to provide a directional overview of the economy.
To access our newest Matrix of Economic Indicators, start a two-week free trial to either Bespoke Premium or Bespoke Institutional now!
Chart of the Day: Memento Memoria
Bespoke’s Morning Lineup – 5/5/26 – Yields Hit Home
See what’s driving market performance around the world in today’s Morning Lineup. Bespoke’s Morning Lineup is the best way to start your trading day. Read it now by starting a two-week trial to Bespoke Premium. CLICK HERE to learn more and start your trial.
“If you don’t use your experience, your past is wasted” – Alan Shepard

Below is a snippet of commentary from today’s Morning Lineup. Start a two-week trial to Bespoke Premium to view the full report.
Yields are behaving themselves this morning as the 10-year US Treasury yield is unchanged at around 4.44%, and near the highest levels since last summer.
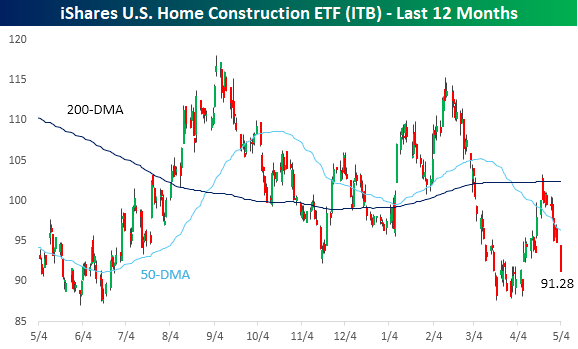
While rising yields haven’t had much of an impact on the overall equity market yet, the same can’t be said for homebuilders. In early February, the iShares US Home Construction ETF (ITB) was near 52-week highs and above $115. Yesterday, it closed at $91.28, or more than 20% below those levels from two months ago. While the S&P 500 is up over 13% from its March lows, ITB has only rallied 3%.
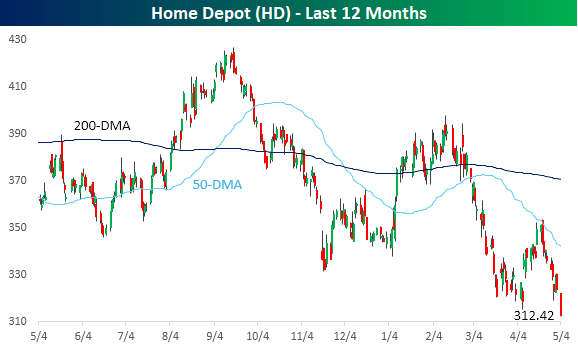
Rising yields have been more painful for housing-related stocks. Home Depot (HD) is a perfect example. Yesterday, the world’s largest home improvement retailer closed at a 52-week low of $312.42. The stock is down over 20% from its February high and over 26% from its 52-week high.
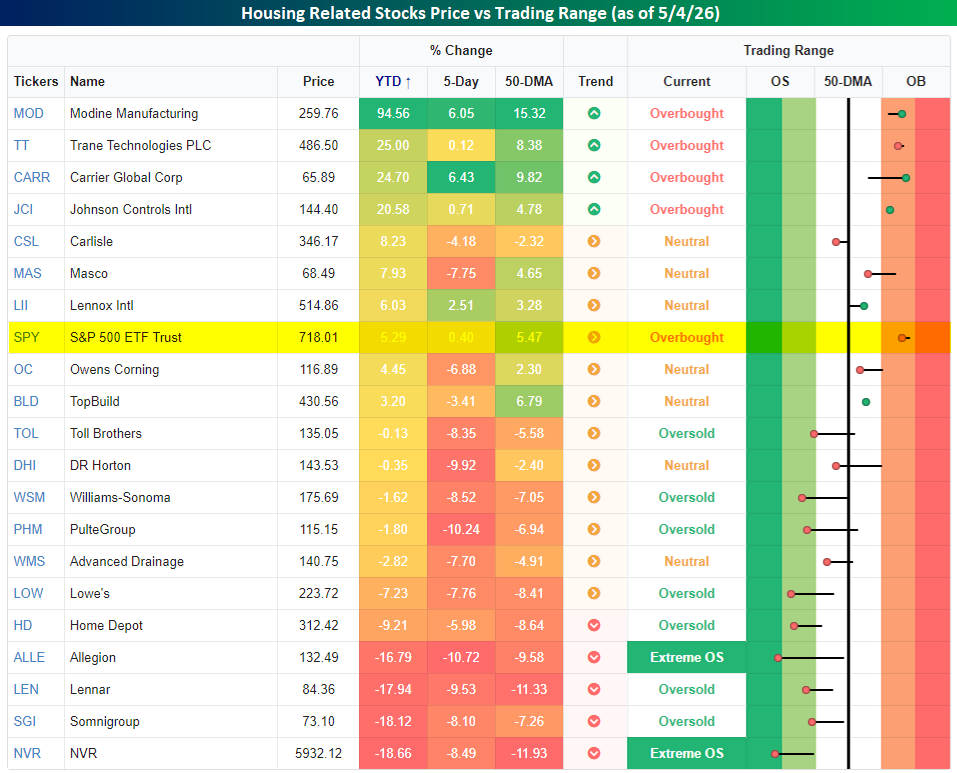
Looking more broadly at housing-related stocks. The snapshot below from our Trend Analyzer shows the 20 largest components in the SPDR S&P Homebuilders ETF (XHB), and the majority are not only underperforming the S&P 500 on a YTD basis, but they’re also down. The last week has been especially painful for the group, as all but six of them are down just as yields have started to spike.
There are some bright spots in terms of performance this year. Stocks like Modine Manufacturing (MOD), Trane Technologies (TT), Carrier Global (CARR), and Johnson Controls (JCI) are all up over 20% YTD, and they’re the only overbought stocks on the list. The rally in these four stocks really has nothing to do with housing, though. They’re all rallying due to the massive demand for cooling in AI data centers.
Turning to the markets this morning, futures are higher with the S&P 500 indicated to open up 0.4% and the Nasdaq rallies 0.6%. As mentioned above, yields have been behaved with the 10-year right around yesterday’s close of 4.44%. Oil prices are giving back some of yesterday’s gains, falling over 2% to just under $104 per barrel in WTI. Lastly, gold prices are up about 1%, while Bitcoin is up over 1% and back above $81K.
In Asia overnight, Japan, China, and South Korea were closed, while Hong Kong dropped 0.8%. In Europe, markets are all open and generally higher. The STOXX 600 is up 0.5%, led higher by Spain (1.35%) and Germany (1.0%). The UK is the main laggard, falling 1.3%.
In the US today, we’ll get service sector PMIs from S&P and ISM, along with New Home Sales and JOLTS.
Start a two-week trial to Bespoke Premium to continue reading today’s full Morning Lineup.
Earnings Triple Plays Piling Up in Q1 2026
Earnings triple plays are showing up at a strong clip this earnings season, with 66 occurrences since mid-April, more than double the pace at the same point last year. The backdrop has been supportive, with the market rewarding triple plays with bigger share-price jumps than usual.
An earnings triple play is a stock that reports earnings and manages to 1) beat analyst EPS estimates, 2) beat analyst sales estimates, and 3) raise forward guidance. You can read more about “triple plays” at Investopedia.com where they’ve given Bespoke credit for popularizing the term.
This week is the last week of heavy earnings for the Q1 2026 season. On a rolling 3-month basis, 70.6% of companies have beaten EPS estimates, while 73.3% of companies have beaten revenue estimates. The last component of the earnings triple play is guidance. Over the last three months, 11% of companies have raised guidance versus 7% that have lowered.
Since the banks began reporting in mid-April, we’ve seen 66 triple plays. At this point last year, there were 30 triple plays, marking a 120% increase year-over-year. At this time a quarter ago, measuring by calendar days from the Monday of the first week of earnings season, there were 16 triple plays.
The average one-day move for all triple plays this season has been a gain of 8.6% versus a five-year average of just over 5%.
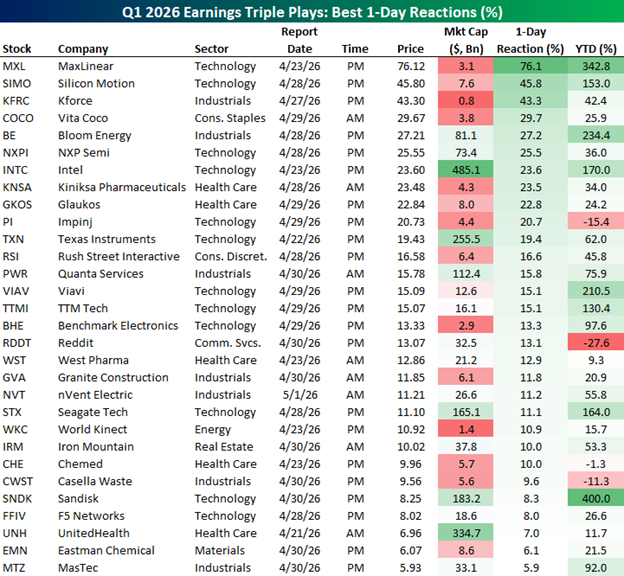
Below is a look at the 30 earnings triple plays this season that saw the largest gains on their earnings reaction days. MaxLinear (MXL) tops the list so far with a one-day gain of 76.1% on April 24th. Including MaxLinear, 24 stocks of the 66 triple plays have risen 10% or more in reaction to their earnings reports.
There have also been several big-name stocks reporting triple plays this quarter. Although NVIDIA (NVDA) has not yet reported, three companies in the trillion-dollar club have reported triple plays: Apple (AAPL), Amazon (AMZN), and Taiwan Semiconductor (TSM).
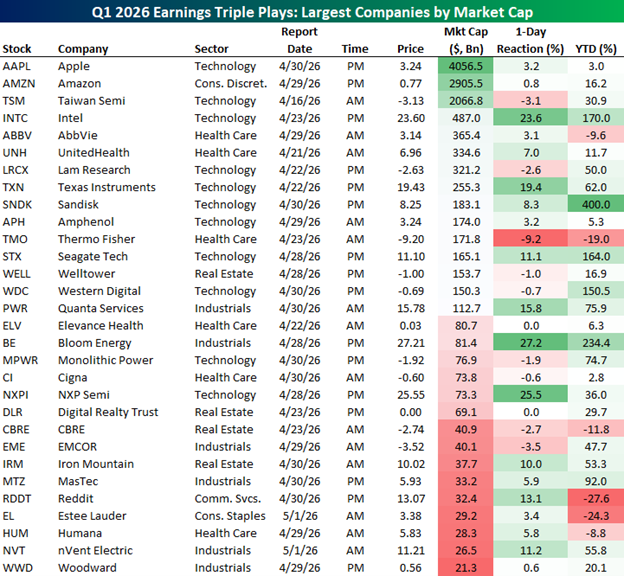
With hundreds more companies still set to report this week, and heavyweights like Walmart (WMT) and NVIDIA (NVDA) still to come after that, there is still plenty of time to run up the triple play score.
We highlight a running list of earnings triple plays daily for subscribers. We also publish more in-depth write-ups on interesting triple plays regularly during earnings season. To gain access to Bespoke’s triple play reports, start a trial to Bespoke Premium or Bespoke All Access today!

Past performance is no guarantee of future results. This is not a recommendation to buy or sell any specific securities. Bespoke representatives or clients may have positions in securities discussed or mentioned in its published content.
The Closer – Modeled Effects, Parcel Paradigm Shift – 5/4/26
Log-in here if you’re a member with access to the Closer.
- The Federal Reserve’s primary macroeconomic model (FRB/US) can be used to estimate impacts to macroeconomic data dependent on various moves in crude prices.
- The announcement that Amazon (AMZN) will expand its supply chain to businesses who are not sellers on its e-commerce platform caused a historic decline in transportation stocks.
- Speculator positioning in Nasdaq 100 futures reached the first net short reading since July 2024.
See today’s full post-market Closer and everything else Bespoke publishes by starting a 14-day trial to Bespoke Institutional today!
Daily Sector Snapshot — 5/4/26
Bespoke Market Calendar — May 2026
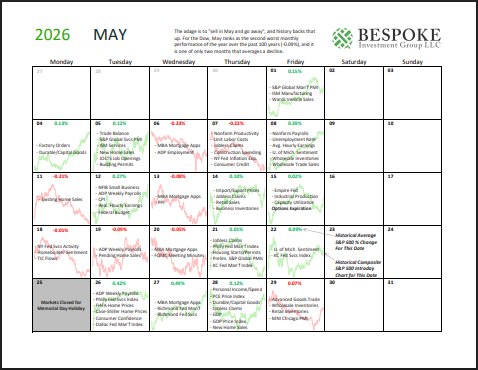
Please click the image below to view our May 2026 market calendar. This calendar includes the S&P 500’s historical average percentage change and average intraday chart pattern for each trading day during the upcoming month. It also includes market holidays and options expiration dates plus the dates of key economic indicator releases.Click here to view Bespoke’s premium membership options.
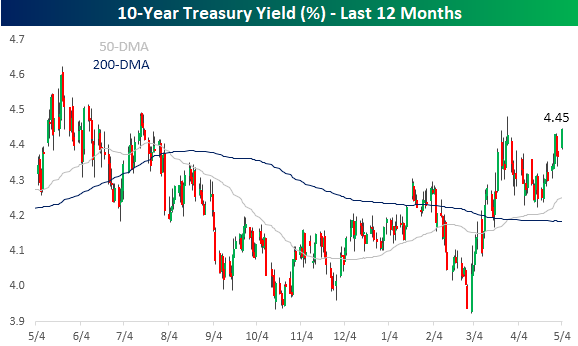
Which Way Will Yields Break
Along with oil prices resuming their upward climb in the last couple of weeks, we’ve also seen a similar resumption of the uptick in interest rates, as investors price in a combination of higher inflation and larger deficits from any potential escalation of hostilities in the Middle East. At a yield of 4.45%, the 10-year US Treasury is on pace for the highest close since last July and not far from the 4.48% high in late March.
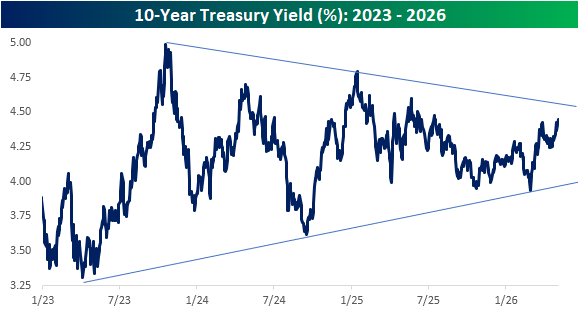
While yields push towards multi-month highs, the last three years have been much more range-bound. Over this period, yields bottomed out just below 3.25% in April 2023 and peaked out just under 5.02% six months ago. Since then, the yield has remained contained in that range with a series of lower highs and higher lows. After bouncing off the low end of that narrowing range in late February, yields are now pushing towards the upper end of that narrowing range as global markets brace for whichever way yields ultimately decide to break.
Like this analysis? Join our Think BIG mailing list or Bespoke Premium by starting a trial today! Click below for details on how to sign up for Premium: