Chart of the Day: Sentiment Slip & Slide
Sentiment Stays Bearish
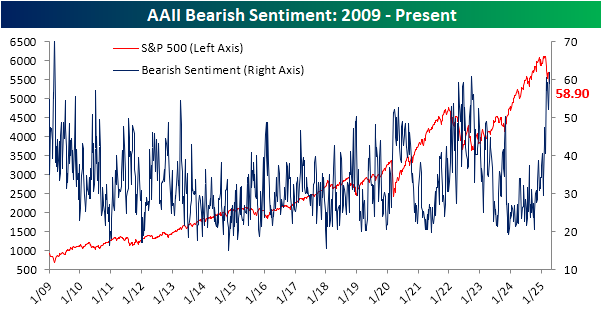
Even before the extreme volatility of the past week, the technical correction in stock prices had meant that investor sentiment tanked. Granted, even when the S&P 500 was last at an all-time high in mid-February sentiment leaned bearish with the percentage of respondents to the weekly AAII survey reporting as bulls only sitting at 29.2% as of February 20. Over the next three weeks, it dropped to local lows in the 19% range and as of today’s release, it was back up to 28.5%. In other words, even through all the crazy moves in the market, investors amazingly appear to be only slightly less bullish than they were at the time of the February 19 high.

Of course, that is still a muted level of bullish sentiment. Meanwhile, the percentage of respondents reporting as bears is much more elevated than it was two months ago. Whereas the February 20 reading in bears was only 40.5%, today it is at 58.9% which was down versus 61.9% last week.
That means that investors continue to overwhelmingly report bearish sentiment with increased polarization to boot. The share of respondents reporting neutral sentiment reaffirms this. That share dropped to a meager 12.5% in the latest week’s data. That ranks in the first percentile of readings in the full history of the data dating back to 1987 and is the lowest reading since it came in at 11% on May 28, 2009.

Of course, other sentiment surveys offer additional looks at investor sentiment. One such report is the Investors Intelligence survey which has a survey base of newsletter writers. One perk of this survey is a much longer history beginning back in 1963. This week’s release indicated the lowest level of bullish sentiment, 23.6%, since December 2008. Before that, the last time sentiment was this weak was in July 1994. So it’s been rare for investors to be this outright negative of equities.
We would also note that this survey collects data through Tuesday afternoons with a release early Wednesday mornings. That means this latest data would not have reflected any reaction to yesterday’s update on tariffs nor the massive surge in stock prices in response.

That weak sentiment is unsurprising given the trade war’s implications for the global economy and the collapse and general volatility in stock prices we have seen in the past week. To help further quantify this, in the chart below we show the percentage spread between the S&P 500’s closing highs and lows for all one-week periods ending Tuesday, which coincides with the Investors Intelligence survey’s collection period, going back to the start of the survey data in 1963. In the latest week, we saw a 12% range between the S&P 500’s high and low on a closing basis, one of the more volatile weeks of this period.

In the chart below, we show those weeks when the S&P 500 had a 10%+ range between high and low closing prices during the Investors Intelligence survey collection period while also trading lower during the span. As shown, the past week was the 18th example. For starters, the S&P 500’s range this go around was middling (47th percentile) for these occurrences although the decline was one of the larger ones, slightly outpacing the median decline of 9.5%.
As for the changes in sentiment, bullish sentiment according to the Investors Intelligence survey is the second lowest of these instances behind late October 2008. The week-over-week decline was also larger than normal, nearly doubling the average move. While that survey’s bearish sentiment reading wasn’t even in line with the average, the week-over-week uptick was again more than double what has historically been the norm during weeks with this much volatility. In other words, currently, we are seeing extreme volatility and extremely bearish investor sentiment, especially among investment professionals (i.e. newsletter writers).


Bespoke’s Morning Lineup – 4/10/25 – Giving Some Back
See what’s driving market performance around the world in today’s Morning Lineup. Bespoke’s Morning Lineup is the best way to start your trading day. Read it now by starting a two-week trial to Bespoke Premium. CLICK HERE to learn more and start your trial.
“Self-praise is for losers. Be a winner. Stand for something. Always have class and be humble.” – John Madden

Below is a snippet of commentary from today’s Morning Lineup. Start a two-week trial to Bespoke Premium to view the full report.
After one of the largest one-day gains in market history yesterday, we’re giving back some of the gains this morning as the S&P 500 is indicated to open 1.75% lower while the Nasdaq is down 2%. European stocks are surging with the STOXX 600 up over 5%, and in Asia overnight, the Nikkei was up over 9% while China saw more muted gains.
We just got March CPI, and the headline and core readings were weaker than expected. Headline CPI dropped 0.1% while core CPI increased just 0.1% versus expectations for an increase of 0.3%. In recent history, this report would send futures sharply higher, but given the looming tariffs, the markets may view it as somewhat stale. Jobless claims were right in line with expectations, ending a streak of five better-than-expected reports. Given concerns over the economy, initial claims have been contained.
As big as yesterday’s move was in the S&P 500, it’s crazy to think that it is still down over 3.5% since last Wednesday’s close and well below both its 50 and 200-day moving averages.

In terms of where various sectors are trading relative to their short-term trading ranges, nine out of eleven are still at oversold levels (1+ standard deviations below their 50-DMAs), and that accounts for yesterday’s big gains!

In yesterday’s session, the SPDR S&P 500 ETF (SPY) traded in an incredible intraday range of 10.8%. Even crazier is that on Tuesday, the intraday range was 7.3% while Monday’s range was 8.6%! Since SPY was launched in 1993, the last three days represent just the sixth time that the ETF has had an intraday range of more than 5% for three or more days. The only periods with as many or more consecutive intraday ranges of at least 5% were in the fourth quarter of 2008 (four separate occurrences) and March 2020. These levels of sustained volatility are truly historic.

The Closer – Tariff Chaos, Momentum Shift, Fed – 4/9/25
Log-in here if you’re a member with access to the Closer.
Looking for deeper insight into markets? In tonight’s Closer sent to Bespoke Institutional clients, after a wild session, we start by reviewing the latest tariff news (page 1) in addition to the reaction across assets (page 2 and 3). Focusing in on equities, we also show just how strong breadth was (page 4) and the incredible turnaround in momentum (page 5). After a review of the latest Fed developments (page 6), we finish by reviewing today’s very strong 10-year note reopening (page 7).

See today’s full post-market Closer and everything else Bespoke publishes by starting a 14-day trial to Bespoke Institutional today!
Chart of the Day: Historic Session But Still a Bad Start to the Administration
Daily Sector Snapshot — 4/9/25
Q1 2025 Earnings Conference Call Recaps: Delta Air Lines (DAL)
Bespoke’s Conference Call Recaps use AI to summarize lengthy earnings calls. The commentary below is AI-generated and then edited by Bespoke for quality control. As always, none of these summaries should be construed as recommendations to buy or sell any securities, and investors should do their own research and/or consult with a financial professional before making any investment decisions.
Our latest recap available to Bespoke subscribers covers Delta Air Lines’ (DAL) Q1 2025 earnings call.
![]()
Delta Air Lines (DAL) is one of the largest global airlines, offering passenger and cargo service to more than 275 destinations across six continents. DAL generates a significant portion of its revenue from premium seating, international travel, and a lucrative co-branded credit card partnership with American Express. The airline is a key barometer for consumer and corporate travel trends. DAL recorded March quarter revenue of $13 billion, but flagged a more difficult operating environment. Domestic main cabin demand was notably weak, prompting plans to cut second-half capacity growth to flat, with specific reductions in off-peak days and Southeastern markets. Premium and loyalty revenues remained resilient, with Amex remuneration up 13% and premium revenue up 7%. International bookings stayed strong, especially on transatlantic and Pacific routes. Executives also warned of tariff risks, stating they won’t accept deliveries of Airbus aircraft with a 20% surcharge. No full-year guidance was given due to macro uncertainty. On better-than-expected results, DAL shares were up as much as 23.4% on 4/9…
Continue reading our Conference Call Recap for DAL by becoming a Bespoke Institutional subscriber. You can sign up for Bespoke Institutional now and receive a 14-day trial to read our newest Conference Call Recap. To sign up, choose either the monthly or annual checkout link below:
Q1 2025 Earnings Conference Call Recaps: WD-40 (WDFC)
Bespoke’s Conference Call Recaps use AI to summarize lengthy earnings calls. The commentary below is AI-generated and then edited by Bespoke for quality control. As always, none of these summaries should be construed as recommendations to buy or sell any securities, and investors should do their own research and/or consult with a financial professional before making any investment decisions.
Our latest recap available to Bespoke subscribers covers WD-40’s (WDFC) Q2 2025 earnings call.
![]()
WD-40 (WDFC) is best known for its namesake Multi-Use Product, a household and industrial lubricant with global brand recognition. Beyond its iconic blue and yellow can, the company develops a range of maintenance products, including the WD-40 Specialist line, serving end users in automotive, industrial, and DIY markets across more than 176 countries. With a lean product portfolio and asset-light model, WDFC offers a window into global industrial demand, distributor dynamics, and consumer-level brand loyalty. WDFC reported 5% sales growth in Q2, or 9% in constant currency, led by double-digit volume gains in EIMEA and a $3.4M lift from Brazil’s new direct distribution model. Premium product sales rose sharply (Smart Straw/EZ Reach up 11%, Specialist up 12%) and e-commerce sales climbed 9% YTD. Gross margin hit 54.6%, up 220 bps, driven by lower can and chemical costs. Supply chain optimizations are expected to offset potential tariff impacts this year. WDFC is actively marketing its homecare and cleaning brands for divestiture, aiming to sharpen its focus on higher-margin maintenance products. Despite rising 3% at the open on 4/8, the stock reversed to end the day almost 9% lower…
Continue reading our Conference Call Recap for WDFC by becoming a Bespoke Institutional subscriber. You can sign up for Bespoke Institutional now and receive a 14-day trial to read our newest Conference Call Recap. To sign up, choose either the monthly or annual checkout link below:
Q4 2024 Earnings Conference Call Recaps: Dave & Buster’s (PLAY)
Bespoke’s Conference Call Recaps use AI to summarize lengthy earnings calls. The commentary below is AI-generated and then edited by Bespoke for quality control. As always, none of these summaries should be construed as recommendations to buy or sell any securities, and investors should do their own research and/or consult with a financial professional before making any investment decisions.
Our latest recap available to Bespoke subscribers covers Dave & Buster’s (PLAY) Q4 2024 earnings call.
![]()
Dave & Buster’s (PLAY) operates a chain of entertainment and dining venues that combine full-service restaurants with large-scale arcades. It appeals to a wide demographic, from families and young adults to corporate event groups. What’s notable is its high ROI on new store builds and innovative game rollouts that keep guests engaged and returning. This quarter’s call centered on undoing strategic missteps by prior leadership. Interim CEO Kevin Sheehan outlined a full operational reset, including a return to TV advertising, simplified promotions like the “Eat & Play Combo,” and reversing unpopular menu changes. A major refresh of arcade offerings is underway, including new attractions like the “Human Crane” and exclusive games such as UFC Challenge and Godzilla VR. Remodel efforts are being slowed and retooled for ROI, while traffic trends in March and April showed marked improvement. PLAY shares gapped up 13.8%, but those gains were completely erased intraday and the stock closed about 2% in the red…
Continue reading our Conference Call Recap for PLAY by becoming a Bespoke Institutional subscriber. You can sign up for Bespoke Institutional now and receive a 14-day trial to read our newest Conference Call Recap. To sign up, choose either the monthly or annual checkout link below:
Bespoke’s Morning Lineup – 4/9/25 – China Responds
See what’s driving market performance around the world in today’s Morning Lineup. Bespoke’s Morning Lineup is the best way to start your trading day. Read it now by starting a two-week trial to Bespoke Premium. CLICK HERE to learn more and start your trial.
“One should always be drunk. That’s all that matters…But with what? With wine, with poetry, or with virtue, as you chose. But get drunk.” ― Charles Baudelaire, Paris Spleen
Below is a snippet of commentary from today’s Morning Lineup. Start a two-week trial to Bespoke Premium to view the full report.
After announcing the reciprocal tariffs in the Rose Garden last week, the President and members of his administration warned other countries not to retaliate. Why they thought some of our largest trade partners would sit back and “take their medicine” with no response is beyond us. This morning, China shot back with its response announcing 84% tariffs on US imports. Futures, which were lower overnight and rallied into the morning, are now back near their lows of the after-hours session, and the S&P 500 looks like it will be on pace to close 20%+ from its record close on 2/19. Up and down, it goes and where it stops nobody knows. Looking on the bright side, while the retaliatory tariffs announced by China have knocked futures lower, it didn’t come with a significant devaluation of the yuan which would have arguably made things worse.
The volatility and magnitude of declines we have experienced over the last several days and weeks is unprecedented. The S&P 500 is on pace for one of its fastest-ever 20% declines from an all-time high. Over the shorter term, consider this. On Monday, the Nasdaq traded down more than 4% on an intraday basis and finished the day higher. Then, on Tuesday, the Nasdaq traded over 4% higher intraday and then finished lower. Back-to-back opposite moves of that magnitude have never happened, and the next closest was in October 2008 when there was a similar reversal of 3%.
Regardless of what the market does today, the Nasdaq’s 50-day moving average (DMA) will cross below the 200-DMA as both are trending lower, forming what technicians call an iron, or death cross.

Today’s moving average crossover will end the fourth-longest streak of the 50-DMA settling above the 200-DMA. At 519 trading days, it was the longest streak since November 2018, and the only two other streaks that were longer ended in September 2015 and September 1998.
